I am currently testing a Windows 11 VM for gaming with GPU passthrough, instead of CachyOS, which I talked about in my previous post. While Linux has made massive strides as a host, Windows still holds several advantages for high-performance virtualization: seamless driver management and crucially-superior handling of virtual displays.
The “Dummy Plug” Problem
In most Linux distributions, users resort to a physical HDMI “dummy plug” to trick the GPU into detecting a monitor. However, Windows supports a much more elegant software-based approach.
Why does this matter? If you are aiming for high-bandwidth, high-refresh-rate remote access, resolution matching is vital. If your physical client is 1080p but your dummy plug forces a 4K output, you are wasting significant compute power and network bandwidth. By utilizing a virtual display, you can match your exact screen size, eliminating unnecessary overhead and maximizing Windows 11 VM performance for streaming.
Gear Up: What You’ll Need
Before we flip the switch, make sure you have these essentials ready:
- Proxmox: Installed and running on your host machine.
- Windows 11 ISO: Download from Microsoft
- VirtIO Drivers: Essential for VM performance. Download here
- Windows 11 Pro License: Grab a deal via Idealo
The Quick-Start Installation
Once you’ve gathered your files, the process is straightforward (if a little tedious).
Here is the “TL;DR” version of the setup:
- You should follow this guide here, it tells you how you need to install Win 11 with drivers (to detect drive and network). Just mount both in Proxmox and when the Win 11 screen allow you to search and install all the drivers.
- Start the VM
Finish Setup: Complete the OS installation and navigate through the (admittedly annoying) Windows 11 “Are you sure you do not want to install M365 and send us telemetry ?”…”Are you really sure? You can decide later too”.
The “Windows Hello” Hurdle (Or: Why I’m Screaming)
Before you can enjoy the glory of Remote Desktop (RDP), you have to dance the Windows security tango.
By default, Windows 11 loves Windows Hello (PINs, biometrics), but RDP usually demands a traditional password.
To get this working, you need to:
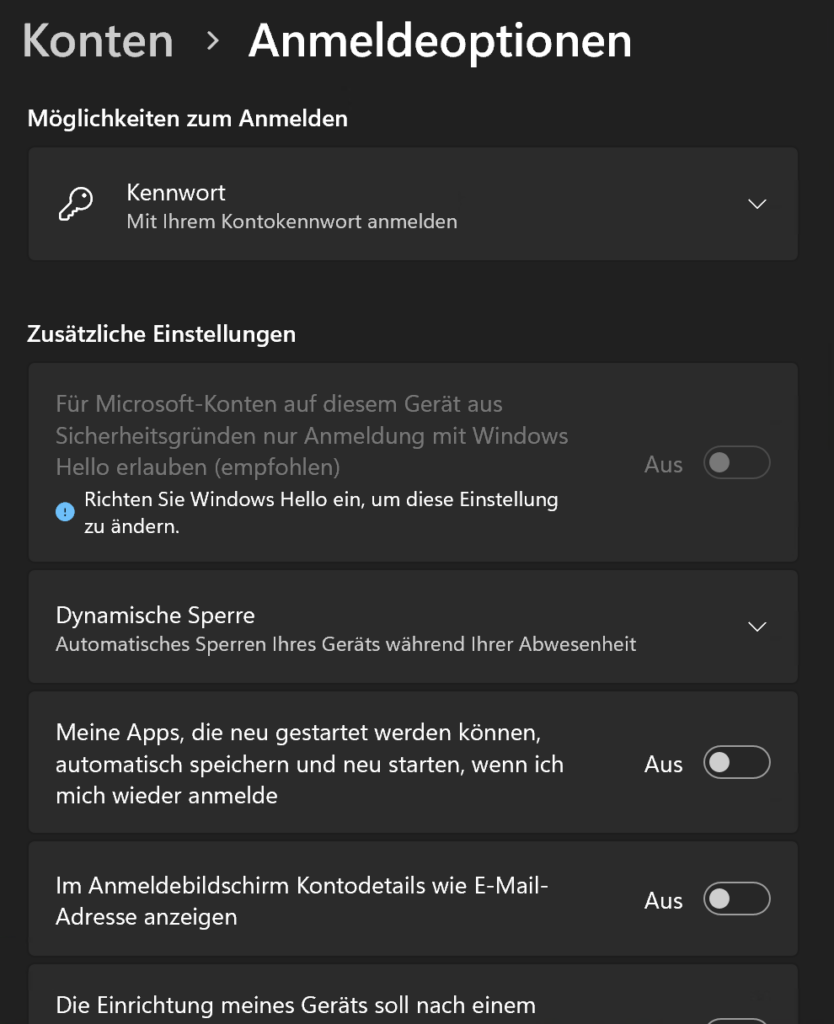
- Disable Windows Hello in the Account Settings.
- Enable Password Login.
- Log in manually with your password at least once.
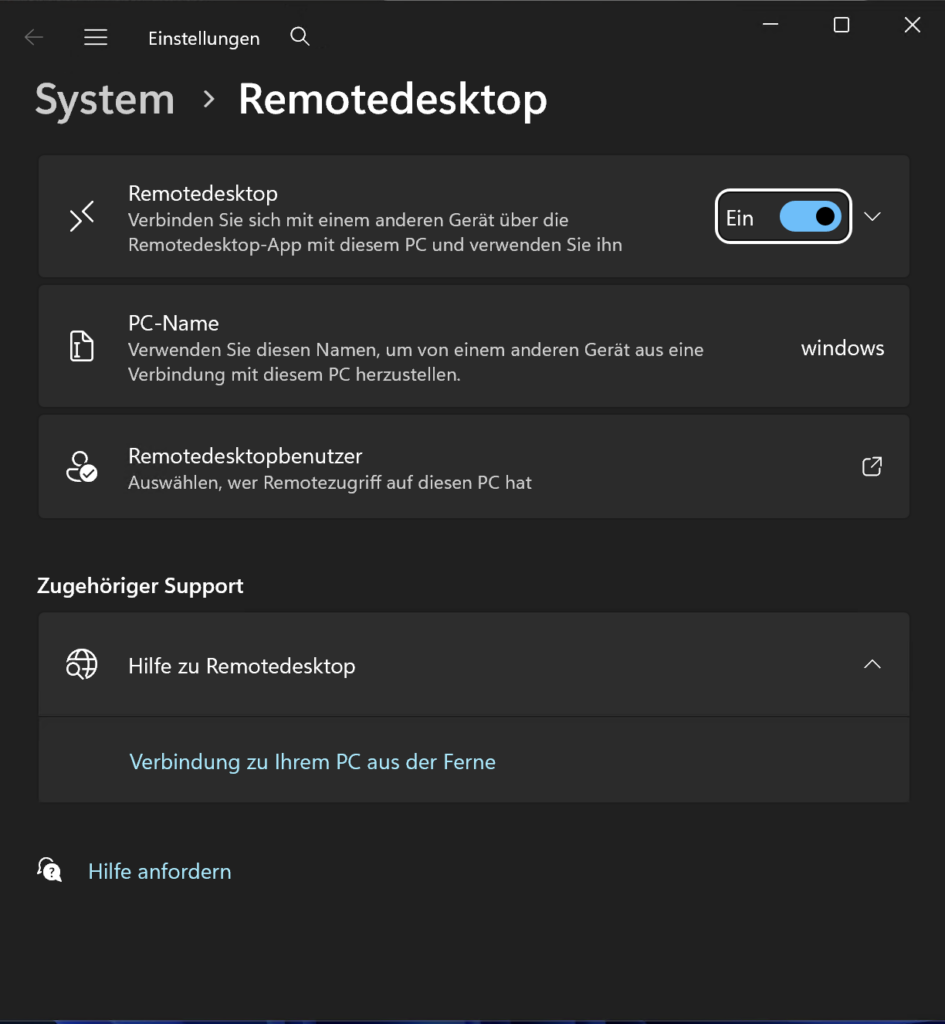
- Enable Remotedesktop
The Struggle is Real: My Microsoft password is a 64-character fortress of symbols and digits. Trying to type that manually into a Windows host with a Mac keyboard while setting up a VM is a special kind of torture. If you see me screaming into the void, this is why.
Trimming the Fat: Debloating Windows 11
Out of the box, Windows 11 is… well, it’s a lot. It’s bloated, heavy, and full of features you’ll never use for gaming. It’s basically the OS equivalent of me after two Döner Kebabs, sluggish and in desperate need of a nap.
Thankfully, Raphire created an incredible script to fix this. (To be clear, it fixes the Windows bloat, not my Döner habit, I tried opening a GitHub issue for the latter, but no luck so far.)
When I run this script, I don’t hold back. I remove basically everything. For a dedicated gaming VM, you want every spare cycle of your CPU and every megabyte of RAM focused on the game, not on “News and Interests” or background telemetry.
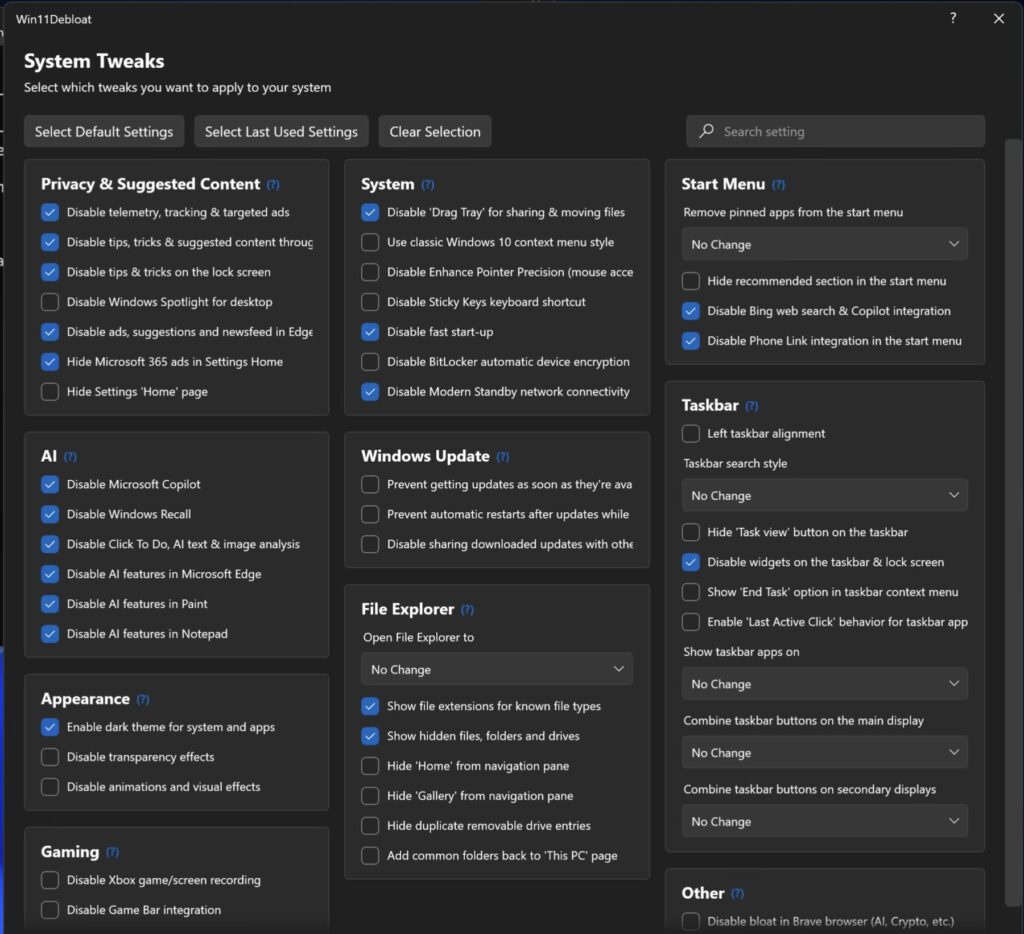
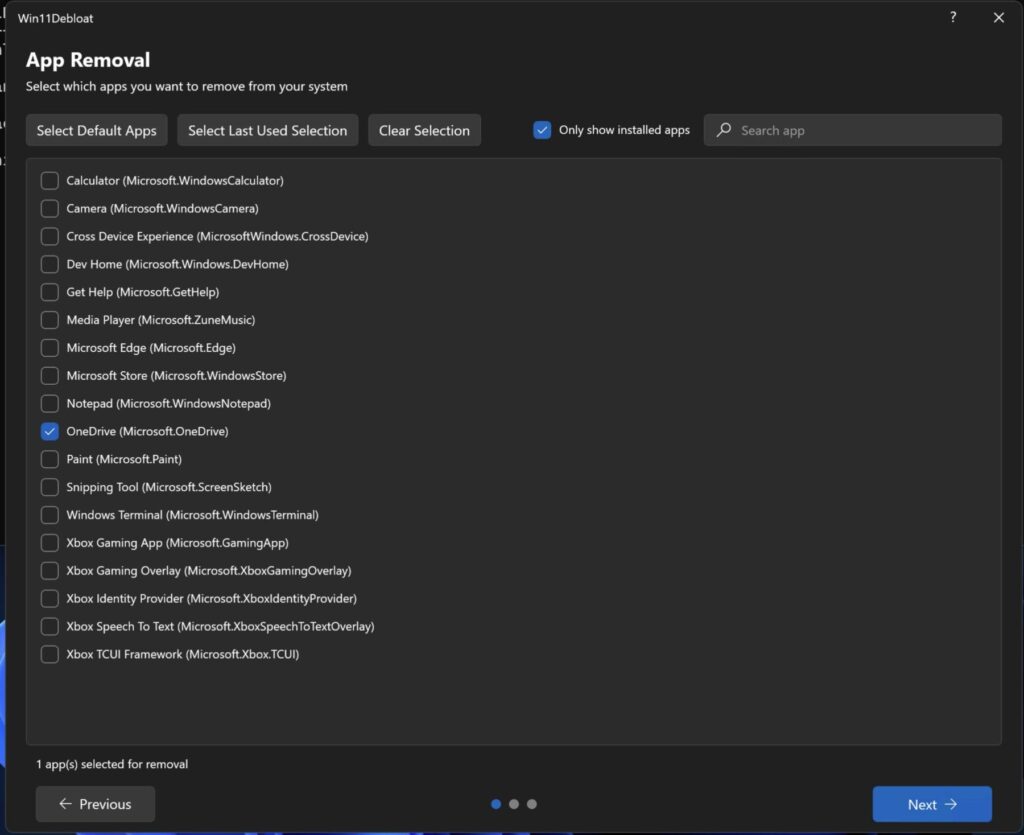
The screenshot on the right shows what’s left after my purge, I removed about 100 preinstalled apps. While the script lets you set system tweaks however you like, I chose to be a bit more selective with the gaming features.
Why I kept the Xbox App: Even though “Xbox” sounds like bloat to some, I decided to keep it in my VM. I use it for actual gaming, I own an Xbox console, and I frequently use gamepads that need those background services to function correctly.
Rule of Thumb: If you plan on using Game Pass or an Xbox Controller, don’t let the script nuking those specific services!
Hardening Windows 11 (Without Breaking It)
Despite what people say, Windows with Defender can be a reasonably secure OS, provided you tweak the right settings and lock it down.
Step 0: SNAPSHOT YOUR VM!
Before you touch a single security setting, take a snapshot in Proxmox. Everything we’re about to do is difficult to reverse. If something breaks, it’s 10x faster to roll back a snapshot than it is to troubleshoot a locked-down registry.
Why Most Hardening Scripts Fail
There are plenty of “Ultra-Hardening” PowerShell scripts out there, but in my experience, they break Windows 100% of the time. People enable every toggle, and suddenly the OS is a digital paperweight.
Instead, I recommend Harden-Windows-Security. You can actually find it in the Microsoft App Store. It provides a GUI that helps you audit your system and align with industry standards (like NIST or CIS).
What I Enable (and Why)
Here is the breakdown of the modules I use:
- Microsoft Security Baseline
- Microsoft Baseline Overrides
- Microsoft Defender
- Attack Surface Reduction (ASR): These are essentially “behavioral” blocks. They stop things like Office apps from creating child processes or scripts from running obfuscated code.
- TLS Security
- Windows Firewall
- Windows Update
- Edge Browser
- Country IP Blocking: Uses Windows Firewall to block traffic from specific geographic regions known for high botnet activity.
- Non-Admin Commands
Fixing the RDP Lockout
Heads up: Enabling these settings will break your RDP login. The “Non-Admin” and “Security Baseline” modules often trigger a policy that views RDP as a security risk for local accounts. You’ll be locked out and forced to log back in via the Proxmox console to fix it:
- Open Local Security Policy: Press
Win + R, typesecpol.msc, and hit Enter. - Navigate to User Rights: In the left pane, go to Local Policies > User Rights Assignment.
- Find the “Deny” Policy: Look for “Deny log on through Remote Desktop Services” on the right side.
- Remove the Block: Double-click it. If you see “Local account” or “Administrators” listed, select them and click Remove.
- Apply & OK: You should now be able to RDP back in.
Summary
By using Raphire’s debloater and Harden-Windows-Security, we’ve transformed a clunky, telemetry-heavy OS into a streamlined secure gaming beast.
Why this setup wins:
- Performance: No more 4K “dummy plug” overhead, just 120 FPS optimized for your actual screen.
- Security: You’ve got a hardened system that would make a CISO proud, without the “broken OS” headaches of more aggressive scripts.
- Convenience: You kept the Xbox services you actually use while nuking the 100+ apps you don’t.
Just remember: Snapshot early and snapshot often. Whether you’re fighting Windows Hello or accidentally locking yourself out of RDP, that “Rollback” button in Proxmox is your best friend.
Now that the OS is lean, mean, and secure, it’s finally time to stop looking at loading bars and start actually playing.
Thank you for reading my short blog post today! Hugs and kisses 😚 byeeeeeeeeee ❤️