Let’s be honest. You wouldn’t leave your front door wide open with a neon sign pointing to your expensive new TV while you went on vacation.
Yet, on the internet, many of us do exactly that every day.
We open ports on our home routers for Plex servers, Minecraft games with friends, NAS drives, or that smart toaster that desperately needs to talk to the mothership for some reason. We poke tiny holes in our home firewalls, assume nobody will notice because the internet is “too big,” and forget about them.
This collection of open digital doors and windows is your personal attack surface. And guess what? There are bots scanning the entire internet 24/7 looking for those open windows. It does not matter if you are a huge company or tiny home user, most attacks are automated, they do not make a difference initially.
Today, we’re going to build an automated watchdog that barks at you on Discord whenever your digital fly is down.
The Toolkit
To build this self-monitoring system, we combined two incredibly powerful tools: n8n and Shodan.
What is n8n?
Think of n8n as digital duct tape with a PhD. It’s a workflow automation tool (like IFTTT or Zapier, but way more powerful and self-hostable) that lets you connect services that have no business talking to each other. It listens for triggers, runs some logic, and performs actions. It’s the butler that runs our automation household.
What is Shodan?
Google crawls websites to see what text is on them. Shodan crawls the infrastructure of the internet. It’s a search engine that doesn’t scan for cute cat blog posts; it scans for IP addresses, open ports, webcams with default passwords, and industrial control systems.
Shodan is basically a global, automated census taker that knocks on every single digital door on the planet, 24/7, and records who answers and what they say.
Our Goal
We wanted a system that runs automatically, checks our home IP address against Shodan’s massive database, and reports back in a human-readable way.
Here is the workflow we built together:

Step 1: The Moving Target (DynDNS)
Most home internet connections have dynamic IPs, they change whenever your ISP feels like it. Trying to monitor yesterday’s IP is useless.
We solved this by using a DynDNS domain (like my-house.example.com). Our script doesn’t check an IP directly; it asks the internet “What is the current IP address for this domain name?” This ensures we are always scanning our current front door.
import socket
import requests


DYNDNS_DOMAIN = "dyndns.example.de"
SHODAN_API_KEY = 'abcdef12345'

try:
    # 2. Resolve the DynDNS Domain to an IP
    # We use socket to look up the 'A' record (IPv4) for your domain
    target_ip = socket.gethostbyname(DYNDNS_DOMAIN)

    # 3. Lookup IP on Shodan (Passive Scan)
    shodan_url = f"https://api.shodan.io/shodan/host/{target_ip}?key={SHODAN_API_KEY}"
    shodan_response = requests.get(shodan_url, timeout=10)

    # Check results
    if shodan_response.status_code == 200:
        scan_data = shodan_response.json()
        found = True
    elif shodan_response.status_code == 404:
        scan_data = {"message": "IP not found in Shodan database."}
        found = False
    else:
        scan_data = {"error": f"Shodan API Error: {shodan_response.status_code}"}
        found = False

    # 4. Return to n8n
    return [{
        "json": {
            "domain": DYNDNS_DOMAIN,
            "resolved_ip": target_ip,
            "shodan_found": found,
            "shodan_data": scan_data
        }
    }]

except socket.gaierror:
    # Handle DNS resolution errors (e.g., if the domain doesn't exist)
    return [{
        "json": {
            "error": "Could not resolve hostname. Check your DynDNS domain.",
            "domain": DYNDNS_DOMAIN
        }
    }]
except Exception as e:
    return [{
        "json": {
            "error": str(e)
        }
    }]
Step 2: Knocking on Shodan’s Door (The API)
Once n8n knows our current IP, it uses a Python script to politely tap Shodan on the shoulder via their API.
We are performing a passive lookup. We aren’t asking Shodan to actively attack our router right now (that costs extra credits and is noisy). We are asking: “Hey Shodan, in your vast database of everything you’ve scanned recently, what do you already know about this IP address?”
We have already included the Shodan API request in the code above.
Step 3: Datacrunching
Shodan replies with a massive, terrifying blob of JSON data. It lists ISPs, geographical locations, open ports (like 80, 443, or weird ones like 8089), and the “banners”—the text those services spit out when connected to.
If we just emailed this raw JSON to ourselves, we’d never read it. We used Python within n8n to sift through the noise. It determines if the scan is “Clean” (safe) or a “Warning” (ports open) and formats a beautiful, color-coded report.
from datetime import datetime

# 1. Get the input data using your preferred syntax
data = _items[0]["json"]

domain = data.get("domain", "Unknown Domain")
ip = data.get("resolved_ip", "Unknown IP")
is_found = data.get("shodan_found", False)
shodan_data = data.get("shodan_data", {})

# 2. Initialize Embed Variables
embed_fields = []

if is_found:
    # --- STATUS: WARNING (Red/Orange) ---
    color = 16744192  # 0xFF7700 (Orange)
    title = f"⚠️ Shodan Alert: {domain}"
    description = f"**Target IP:** `{ip}`\n**Status:** Exposed services found."

    # Extract specific details from your JSON structure
    # Use 'get' with defaults to prevent crashes
    org = shodan_data.get("org", "Unknown Org")
    city = shodan_data.get("city", "Unknown City")
    country = shodan_data.get("country_name", "Unknown Country")

    # Extract Ports
    # In your JSON, 'ports' is a list [8089]
    ports = shodan_data.get("ports", [])
    ports_str = ", ".join(map(str, ports)) if ports else "None detected"

    # Extract Service Banners (from the 'data' list in your JSON)
    # This shows *what* is running on the port (e.g., HTTP 404)
    service_details = []
    for service in shodan_data.get("data", []):
        p = service.get("port")
        # Try to get a product name, otherwise grab the raw data banner
        banner = service.get("product") or service.get("data", "").strip()
        # Truncate banner if it's too long for Discord
        if len(banner) > 50:
            banner = banner[:47] + "..."
        service_details.append(f"**Port {p}:** `{banner}`")

    services_str = "\n".join(service_details) if service_details else "No service banners captured."

    # Build the Fields
    embed_fields = [
        {"name": "🏢 Organization", "value": org, "inline": True},
        {"name": "🌍 Location", "value": f"{city}, {country}", "inline": True},
        {"name": "🔓 Open Ports", "value": ports_str, "inline": True},
        {"name": "🔎 Service Details", "value": services_str, "inline": False}
    ]

else:
    # --- STATUS: SAFE (Green) ---
    color = 5763719  # 0x57F287 (Green)
    title = f"✅ Clean Scan: {domain}"
    description = f"**Target IP:** `{ip}`\n**Status:** No open ports found on Shodan."
    embed_fields = [
        {"name": "Result", "value": "IP address is not indexed or has no public services.", "inline": False}
    ]

# 3. Construct the Final Discord Webhook Payload
discord_payload = {
    "username": "Shodan Bot",
    "avatar_url": "https://static-00.iconduck.com/assets.00/shodan-icon-512x512-j6i1s0d4.png",
    "embeds": [{
        "title": title,
        "description": description,
        "color": color,
        "fields": embed_fields,
        "footer": {
            "text": f"Scan Time: {datetime.now().strftime('%Y-%m-%d %H:%M:%S')}"
        }
    }]
}

# 4. Return formatted for the next node
return [{"json": discord_payload}]
Step 4: Discord Webhook
Finally, n8n takes that nicely formatted report and fires it off to a private Discord channel via a Webhook.
# n8n Code Node: Post to Discord
import requests
DISCORD_WEBHOOK_URL = "https://discord.com/api/webhooks/"
# Get the input data (which is the Discord payload itself)
payload = _items[0]["json"]
try:
resp = requests.post(
DISCORD_WEBHOOK_URL,
json=payload,
timeout=(5, 10),
)
resp.raise_for_status()
# Return success status
return [{
"json": {
"status": resp.status_code,
"sent": True,
"target": payload.get('embeds', [{}])[0].get('title', 'Unknown Target')
}
}]
except Exception as e:
# Return error details
return [{
"json": {
"error": str(e),
"sent": False,
"failed_payload": payload
}
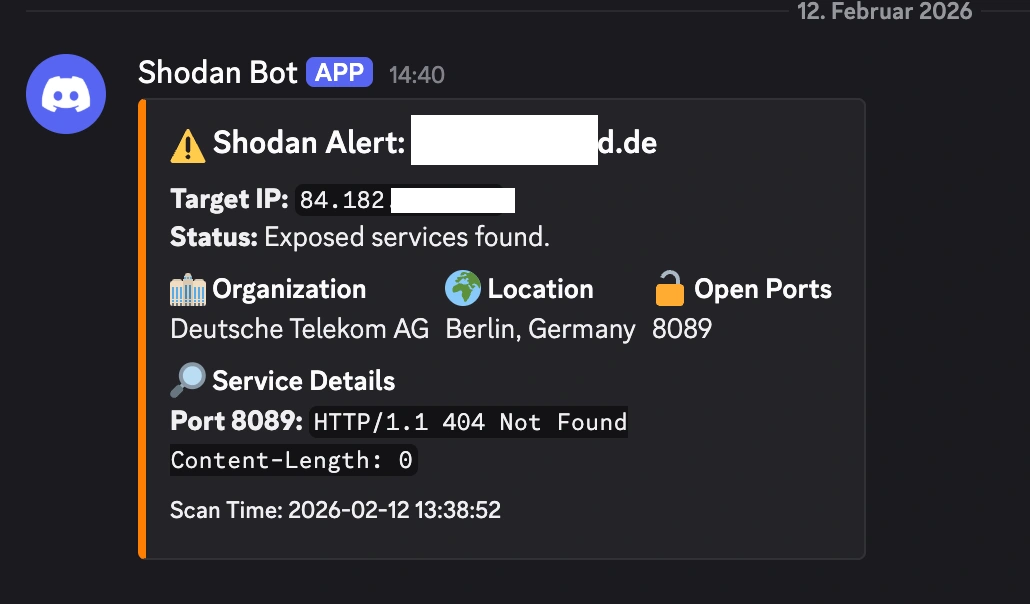
}]The Result: Sleeping Better at Night
Now, I have a dedicated channel in Discord. Most days, I get a comforting little green ping:
✅ Clean Scan: https://www.google.com/url?sa=E&source=gmail&q=my-house.example.com
Target IP: 84.182.x.x
Status: No open ports found on Shodan.
But sometimes, if I’ve been messing around with a new server project and forgot to close a firewall rule, I get the orange text of doom:
⚠️ Shodan Alert: https://www.google.com/url?sa=E&source=gmail&q=my-house.example.com
Location: Berlin, Germany | ISP: Deutsche Telekom AG
🔓 Open Ports:
8089🔎 Service Details: Port 8089:
HTTP/1.1 404 Not Found...
It’s a fantastic, low-effort way to keep tabs on your personal attack surface and overall cybersecurity posture. If Shodan can see it, the bad guys can see it too. You might as well know first. If you want to go deeper on active testing, check out my hands-on review of AI pentesting agents.
I am always trying to find cool ways to use my n8n instance, we could just have it run an nmap scan like in my Node-RED nmap-as-a-service post:
but I figured why not use the Shodan API this time ✌️
Anyways thanks for being here to read my post, sleep tight, kisses, byeeeeeee 😍