Securing a WordPress hosting setup requires more than just the basics—it’s about creating a layered defense to protect your server and adapt to emerging threats. Today I am going to show you what I do to keep Karlcom hosted systems secure from outside attackers.
Firewall Restriction
To minimize exposure, my server only accepts traffic from Cloudflare’s IP ranges and only on port 443. This ensures that attackers cannot directly access my server’s IP address, significantly reducing the attack surface.
On my Firewall it looks like this:
One rule to allow Cloudflare
One to allow my server to come back in from the internet
One block all rule for anything else
This works pretty well so far.
Cloudflare’s Web Application Firewall (WAF)
I leverage Cloudflare’s free WAF to filter out malicious traffic before it reaches my server. It’s an effective first line of defense that helps block known attack patterns and suspicious behavior.
I felt kind of weird sharing my WAF rules here, since you know people reading this can use them to build scans that get around but I figured, I am up for the challenge so lets go:
(starts_with(http.request.full_uri,"http://10.107.0.150//xmlrpc.php")) or (starts_with(http.request.full_uri,"http://10.107.0.150/xmlrpc.php")) or (ends_with(http.request.uri,"xmlrpc.php")) or (http.request.full_uricontains"setup-config.php") or (http.request.full_uricontains"wp-admin/install.php") or (http.request.uri.pathwildcardr"//*")
This is pretty WordPress specific, I know you can set these on your reverse proxy as well as your wordpress server as well, but I figured letting Cloudflare handle it with their admittedly much more powerful server and taking some steam off of mine would be a good thing to do.
EDIT:
While writing this post attacks changed a little and I got some really annoying scans from some IP ranges that all came from Russia, so I ended up Rick Rolling all Russian IPs trying to get through to my home network. Nothing personal.
Continuous Monitoring with Grafana Labs Loki
Despite these measures, some scanners and attackers still manage to slip through. To address this, I use Grafana Labs Loki to analyze server logs. By identifying suspicious activity or unusual access paths, I can create new Cloudflare WAF rules to block emerging threats proactively.
Here you can see some scans from the outside that made it through. I have since updated the WAF rules to block them as well.
Updates
As I mentioned in my post about backing up data, I automate the updates for all my LXCs, VMs, and container images. While this approach does carry the risk of introducing breaking changes, the time and effort saved by automating these updates outweigh the potential downsides for me at this stage. Manual maintenance just isn’t practical for my setup right now.
Since I do daily backups I can recover real fast.
The Cycle of Security
This process of monitoring, analyzing, and refining creates an ongoing cycle of security improvements. It’s a proactive and dynamic approach that keeps my server well-protected against evolving threats.
If you’re using a similar setup or have additional tips for securing WordPress hosting, I’d love to hear your thoughts. Sharing strategies and experiences is one of the best ways to stay ahead of attackers.
That said, I’m genuinely curious if any attackers reading this will now take it as a challenge to get around my defenses. For that very reason, I stay vigilant, regularly auditing my Grafana logs at home. Security is a constant effort, and in my case, we have SIEM at home, son!
Today, I want to walk you through how I handle backups for my home server. My primary method is using Proxmox’s built-in backup functionality, which I then sync to a Hetzner Storage Box for added security.
When it comes to updates, I like to live on the edge. I enable automatic (security) updates on nearly all of my systems at home using UnattendedUpgrades. For containers, I usually deploy a Watchtower instance to keep them updated automatically. While this approach might make some people nervous—fearing a broken system after an update—I don’t sweat it. I back up daily and don’t run any mission-critical systems at home (except for this blog, of course 😉).
For specific files or directories, like Vaultwarden, I take an extra layer of precaution by creating additional backups within the LXC container itself. These backups are synced to a Nextcloud instance I also manage through Hetzner, but in a different datacenter. Hetzner’s “Storage Shares” offer a great deal—€5 gets you 1TB of managed Nextcloud storage. While not the fastest, they’re reliable enough for my needs.
I won’t dive into the details here, but my approach for these backups is pretty straightforward: I use ZIP files and rclone to upload everything to Nextcloud.
Here is my script, maybe it helps you in some way:
#!/bin/bash# VariablesBITWARDEN_DIR="/root/bitwarden"BACKUP_DIR="/root/bitwarden-backup"NEXTCLOUD_REMOTE="nextcloud:Vaultwarden"TIMESTAMP=$(date '+%Y%m%d-%H%M')# Ensure backup directory existsmkdir-p $BACKUP_DIR# Create a single tarball of the entire Vaultwarden directoryecho"Creating a full backup of the Vaultwarden directory..."tar-czvf $BACKUP_DIR/vaultwarden_full_backup-${TIMESTAMP}.tar.gz-C $BITWARDEN_DIR .# Sync the backup to Nextcloudecho"Uploading backup to Nextcloud..."rclonecopy $BACKUP_DIR $NEXTCLOUD_REMOTE# Clean up local backup directoryecho"Cleaning up local backups..."rm-rf $BACKUP_DIRecho"Backup completed successfully!"
Basically, all you need to do is create an App Password and follow the Rclone guide for setting up with WebDAV. It’s straightforward and works seamlessly for this kind of setup.
Backups in Proxmox
Proxmox makes backups incredibly simple with its intuitive functionality. I back up pretty much everything—except for my Gaming VM. It’s a Windows 11 experiment where I’ve passed through my AMD RX7900XT for gaming. Ironically, instead of gaming, I end up spending more time tweaking backups and writing about them. Let’s just say that gaming setup hasn’t exactly gone as planned.
I rely on Snapshot mode for my backups, and you can explore all its features and settings right here. As I mentioned earlier, I tend to restore backups more frequently than most people, and I’ve never faced any issues with inconsistencies. It’s been consistently reliable for me!
For retention, I keep it straightforward by saving only the last two backups. Since I also back up my backups (as you’ll see later), this minimalist approach is more than sufficient for my needs and saves me some space.
I left the rest of the settings as they are. The note templates are useful if you’re managing a large or multiple instances, but for my setup, I don’t use them.
Trigger warning: For now, I’m storing these backups on a single internal Seagate IronWolf (12 TB). I know, not ideal. These drives are pretty pricey, but one day I plan to add another and set up a ZFS mirror or RAID for better redundancy. For now, I’m relying on this one drive—fingers crossed, it’s been rock solid so far!
Borg(Backup)
The first thing I heard when I proudly told my friends that I was finally taking the golden 3-2-1 backup rule seriously was: “Why not restic?”
The simple answer? I Googled “backups to Hetzner Storage Box,” and the first result was an article explaining exactly what I wanted to do—using Borg 🤷♂️. Before I even considered trying restic, I had already set up encrypted incremental backups with Borg. Feel free to share what you use and why you might have switched, but for now, this setup works perfectly for me!
Hetzner Storage Box
Just to clarify, I’m not talking about Hetzner Storage Share 😁. I’m using their 5TB Storage Box and opted for Finland 🇫🇮 as the location since I already have other Karlcom-related stuff in their German datacenter. It helps keep things spread out a bit!
Essentially, it’s a big, affordable storage backend with multiple options for uploading data. You could mount it using the “Samba/CIFS” option, but I decided against that. Instead, I went with a more secure SSH connection to send my backups there.
I know, it seems like you came here just to find links to set this up somewhere else. But don’t worry—I’ve got some cool stuff to share with you next. Here’s my backup script:
/usr/local/bin/proxmox_borg_backup.sh
#!/bin/bash# VariablesBORG_REPO="ssh://[email protected]:23/home/backups/central"BORG_PASSPHRASE=''BACKUP_SOURCE="/mnt/pve/wd_hdd_internal/dump" LOG_FILE="/var/log/proxmox_borg_backup.log" MAX_LOG_SIZE=10485760RID=`uuidgen`CHECK_ID="ggshfo8-9ca6-1234-1234-326571681"# startcurl-fsS-m10--retry5"https://ping.yourdomain.de/ping/$CHECK_ID/start?rid=$RID"# Export Borg passphraseexportBORG_PASSPHRASE# Rotate log file if it exceeds MAX_LOG_SIZEif [ -f"$LOG_FILE" ] && [ $(stat-c%s "$LOG_FILE")-gt $MAX_LOG_SIZE ]; thenmv"$LOG_FILE""${LOG_FILE}_$(date +"%Y-%m-%d_%H-%M-%S")"touch"$LOG_FILE"fi# Check for BorgBackup installationif!command-vborg &> /dev/null; thenecho"ERROR: BorgBackup is not installed or not in PATH.">>"$LOG_FILE"exit1fi# Check for SSH connectionif!ssh-q-oBatchMode=yes-oConnectTimeout=5-p23-i~/.ssh/backupu123456@u123456.your-storagebox.deexit; thenecho"ERROR: Unable to connect to Borg repository.">>"$LOG_FILE"exit1fi# Logging start time{echo"==== $(date +"%Y-%m-%d %H:%M:%S") Starting Proxmox Backup ===="# Check if the backup source existsif [ !-d"$BACKUP_SOURCE" ]; thenecho"ERROR: Backup source directory $BACKUP_SOURCE does not exist!"exit1fi# Create a new Borg backupecho"Creating Borg backup..."borgcreate--stats--compressionzstd\"$BORG_REPO::backup-{now:%Y-%m-%d}"\"$BACKUP_SOURCE">>"$LOG_FILE"2>&1if [ $?-ne0 ]; thenecho"ERROR: Borg backup failed!"exit1fi# Prune old backups to save spaceecho"Pruning old backups..."borgprune--stats\--keep-daily=7\--keep-weekly=4\--keep-monthly=6\"$BORG_REPO"if [ $?-ne0 ]; thenecho"ERROR: Borg prune failed!"exit1fiecho"==== $(date +"%Y-%m-%d %H:%M:%S") Proxmox Backup Completed ===="} >>"$LOG_FILE"2>&1# finishedcurl-fsS-m10--retry5"https://ping.yourdomain.de/ping/$CHECK_ID?rid=$RID"
The curl requests at the top and bottom of the script are for my Healthchecks.io instance—I even wrote a blog post about it here.
Before moving on, you should definitely test this script. Depending on the size of your setup, the initial backup could take several hours. However, if it doesn’t fail within the first 10 seconds, that’s usually a good sign. To be sure it’s running smoothly, check the log file to confirm it started correctly:
/var/log/proxmox_borg_backup.log
==== 2025-01-10 01:39:07 Starting Proxmox Backup ====Creating Borg backup...------------------------------------------------------------------------------Repository:ssh://u123456@ u123456.your-storagebox.de:23/home/backups/centralArchive name: backup-2025-01-10Archive fingerprint: z724gf2789hgf972hf9uh...Time (start): Fri, 2025-01-10 01:39:08Time (end): Fri, 2025-01-10 05:36:41Duration:3 hours 57 minutes 32.92 secondsNumber of files: 72Utilization of max. archive size: 0%------------------------------------------------------------------------------ Original size Compressed size Deduplicated sizeThis archive: 62.03 GB 61.98 GB 61.60 GBAll archives: 62.03 GB 61.98 GB 61.60 GB Unique chunks Total chunksChunk index: 24030 40955------------------------------------------------------------------------------Pruning old backups...------------------------------------------------------------------------------ Original size Compressed size Deduplicated sizeDeleted data: 0 B 0 B 0 BAll archives: 62.03 GB 61.98 GB 61.60 GB Unique chunks Total chunksChunk index: 24030 40955------------------------------------------------------------------------------==== 2025-01-10 05:36:42 Proxmox Backup Completed ====
Security of BORG_PASSPHRASE
I decided to include the passphrase for encryption and decryption directly in the script because it fits within my threat model. My primary concern isn’t someone gaining access to my local Proxmox server and restoring or deleting my backups—my focus is on protecting against snooping by cloud providers or malicious admins.
Having the passphrase in the script works for me. Sure, there are other ways to handle this, but for the script to run automatically, you’ll always need to store the passphrase somewhere on your system. At the very least, it has to be accessible by root. This setup strikes the right balance for my needs.
Systemd timers
I created a system service to handle this backup process. For long-running jobs, it’s generally better to use systemd timers instead of cron, as they’re less prone to timeouts. I found this post particularly helpful when setting it up.
Here’s the service that actually runs my bash script:
And here’s the systemd timer that handles scheduling the service:
/etc/systemd/system/proxmox_borg_backup.timer
[Unit]Description=Run Proxmox BorgBackup Daily at 3AM[Timer]OnCalendar=*-*-* 03:00:00Persistent=true[Install]WantedBy=timers.target
Now, instead of enabling the service directly, you enable and start the timer. The timer will take care of starting the service according to the schedule you’ve defined. This setup ensures everything runs smoothly and on time!
That’s it! You’re all set. You can check the log file we created or use the journalctl command to review any errors or confirm successful runs. Happy backing up! 🎉
Bash
journalctl-xeuproxmox_borg_backup.timer# or tail-n50/var/log/proxmox_borg_backup.log
Conclusion
You should now have an easy and efficient solution to back up your Proxmox backups to a Hetzner Storage Box using Borg Backup. Both Borg and Restic support a variety of storage targets, so you can adapt this approach to suit your needs. In my setup, Borg performs incremental backups, uploading only new data, which helps keep storage costs low while maintaining security.
A word of caution: don’t lose your secrets—your encryption key or passphrase—because without them, you won’t be able to restore your data. Trust me, I’ve been there before! Thankfully, I had local backups to fall back on.
On Hetzner, I schedule daily backups at noon, after all my backup jobs have completed. I retain only the last three days, which works perfectly for me, though your needs might differ. Just remember that snapshot storage counts toward your total storage capacity—so if you have 1TB, the space used by snapshots will reduce the available storage for new data.
Thank you for reading! May your backups always be safe, your disks last long, and your systems run smoothly. Wishing you all the best—love you, byeeeeee! ❤️🚀
This is going to be a bold, highly opinionated take on how note-taking apps should be. For the non-technical folks, discussing text editors and note-taking apps with IT people is like walking straight into a heated geopolitical debate at the family Thanksgiving table—it’s passionate, intense, and probably never-ending. Gobble Gobble.
There are probably even more apps I have used in the past, but these are the ones that left a lasting impression on me. First off, let me just say—I love taking notes in Markdown. Any app that doesn’t support Markdown is pretty much useless to me. I’m so much faster at writing styled notes this way, without the hassle of clicking around or memorizing weird shortcut commands.
For me, HedgeDoc hit the sweet spot. It’s got just the right features and just the right amount of organization. I’m not looking for an app to micromanage my entire life—I just want to take some damn notes!
Live editing has also become a game-changer for me. I often have multiple screens open, sometimes even on different networks, and being instantly up-to-date while copy-pasting seamlessly between them is invaluable. Before HedgeDoc, I was using Obsidian synced via Nextcloud, but that was neither instant nor reliable on many networks.
And let’s talk about security. With HedgeDoc, it’s a breeze. Their authorization system is refreshingly simple, and backing up your notes is as easy as clicking a button. You get a ZIP file with all your Markdown documents, which you could technically use with other editors—but why would you? HedgeDoc feels like it was made for you, and honestly, you’ll feel the love right back.
I run HedgeDoc inside a container on my server, and it’s rock-solid. It just works. No excessive resource use, no drama—just a tool that quietly does its job.
Now, let’s dive in! I’m going to show you how to host HedgeDoc yourself. Let’s get started!
Prerequisites
Here’s what you’ll need to get started:
A Linux distribution: Any modern Linux distro that supports Docker will work, but for today, we’ll go with Alpine.
A server with a public IP address: While not strictly mandatory, this is highly recommended if you want to access your note-taking app from anywhere.
A reverse proxy: Something like Caddy or Nginx to handle HTTPS and make your setup accessible and secure.
Got all that? Great—let’s get started!
Setup
Here’s a handy script to install Docker on a fresh Alpine setup:
init.sh
#!/bin/sh# Exit on any errorset-eecho"Updating repositories and installing prerequisites..."cat<<EOF> /etc/apk/repositorieshttp://dl-cdn.alpinelinux.org/alpine/latest-stable/mainhttp://dl-cdn.alpinelinux.org/alpine/latest-stable/communityEOFapkupdateapkadd--no-cachecurlopenrcdockerdocker-composeecho"Configuring Docker to start at boot..."rc-updateadddockerbootservicedockerstartecho"Verifying Docker installation..."docker--versionif [ $?-ne0 ]; thenecho"Docker installation failed!"exit1fiecho"Verifying Docker Compose installation..."docker-compose--versionif [ $?-ne0 ]; thenecho"Docker Compose installation failed!"exit1fiecho"Docker and Docker Compose installed successfully!"
To make the script executable and run it, follow these steps:
Bash
chmod+xinit.sh./init.sh
If everything runs without errors, Docker should now be installed and ready to go. 🎉
To install HedgeDoc, we’ll follow the steps from their official documentation. It’s straightforward and easy
I prefer to keep all my environment variables and secrets neatly stored in .env files, separate from the actual Compose file.
.env
POSTGRES_USER=hedgedoctorPOSTGRES_PASSWORD=super_secure_passwordPOSTGRES_DB=hedgedocCMD_DB_URL=postgres://hedgedoctor:super_secure_password@database:5432/hedgedocCMD_ALLOW_FREEURL=trueCMD_DOMAIN=docs.yourdomain.deCMD_PROTOCOL_USESSL=trueCMD_ALLOW_ANONYMOUS=falseCMD_ALLOW_EMAIL_REGISTER=true# <- remove after you registered
To keep things secure, it’s a good idea to set CMD_ALLOW_ANONYMOUS to false, so anonymous users can’t edit your documents. For added security, you can create your own account and then disable CMD_ALLOW_EMAIL_REGISTER to prevent outsiders from signing up, effectively locking down HedgeDoc.
One great benefit of using the env_file directive in your Docker Compose setup is that it keeps your Compose files clean and tidy:
After running docker compose up -d, you should be all set! This setup assumes you already have a reverse proxy configured and pointing to the public domain where you’re hosting your HedgeDoc. If you need help setting that up, I’ve written a guide on it in another blog post.
Keep in mind, with the settings in the .env file above, HedgeDoc won’t work unless it’s served via HTTPS through the reverse proxy using the domain you specified.
Once everything’s in place, you should see the HedgeDoc login screen and be able to “Register” your account:
Don’t forget to head back to your .env file and comment out that specific line once you’re done:
.env
...# CMD_ALLOW_EMAIL_REGISTER=true # <- remove after you registered
This ensures that no one else can create accounts on your HedgeDoc instance.
Personally, I always set my notes to “Private” (you can do this in the top right). That way, even if I decide to let others use the instance later, I don’t have to worry about any old notes where I might have called them a stinky doodoo face (as one does):
You can still share your documents with others, but you’ll need to change the setting to “Locked.” Anything more restrictive will prevent people from viewing your notes.
Imagine sending your crush a beautifully crafted, markdown-styled love letter, only for them to get blocked because of your overly strict settings. Yeah… couldn’t be me.
Conclusion
I conclude —our notes are ready, no need for more WordPress blog posts. Now it’s time to hit the gym because it’s chest day, and let’s be honest, chest day is the best day! 💪
As a principal incident responder, my team and I often face the challenge of analyzing potentially malicious websites quickly and safely. This work is crucial, but it can also be tricky, especially when it risks compromising our test environments. Burning through test VMs every time we need to inspect a suspicious URL is far from efficient.
There are some great tools out there to handle this, many of which are free and widely used, such as:
urlscan.io – A tool for visualizing and understanding web requests.
VirusTotal – Renowned for its file and URL scanning capabilities.
Joe Sandbox – A powerful tool for detailed malware analysis.
Web-Check – Another useful resource for URL scanning.
While these tools are fantastic for general purposes, I found myself needing something more tailored to my team’s specific needs. We needed a solution that was straightforward, efficient, and customizable—something that fit seamlessly into our workflows.
So, I decided to create it myself: Sandkiste.io. My goal was to build a smarter, more accessible sandbox for the web that not only matches the functionality of existing tools but offers the simplicity and flexibility we required for our day-to-day incident response tasks with advanced features (and a beautiful UI 🤩!).
Sandkiste.io is part of a larger vision I’ve been working on through my Exploit.to platform, where I’ve built a collection of security-focused tools designed to make life easier for incident responders, analysts, and cybersecurity enthusiasts. This project wasn’t just a standalone idea—it was branded under the Exploit.to umbrella, aligning with my goal of creating practical and accessible solutions for security challenges.
The Exploit.to logo
If you haven’t explored Exploit.to, it’s worth checking out. The website hosts a range of open-source intelligence (OSINT) tools that are not only free but also incredibly handy for tasks like gathering public information, analyzing potential threats, and streamlining security workflows. You can find these tools here: https://exploit.to/tools/osint/.
Technologies Behind Sandkiste.io: Building a Robust and Scalable Solution
Sandkiste.io has been, and continues to be, an ambitious project that combines a variety of technologies to deliver speed, reliability, and flexibility. Like many big ideas, it started small—initially leveraging RabbitMQ, custom Golang scripts, and chromedp to handle tasks like web analysis. However, as the project evolved and my vision grew clearer, I transitioned to my favorite tech stack, which offers the perfect blend of power and simplicity.
Here’s the current stack powering Sandkiste.io:
Django & Django REST Framework
At the heart of the application is Django, a Python-based web framework known for its scalability, security, and developer-friendly features. Coupled with Django REST Framework (DRF), it provides a solid foundation for building robust APIs, ensuring smooth communication between the backend and frontend.
Celery
For task management, Celery comes into play. It handles asynchronous and scheduled tasks, ensuring the system can process complex workloads—like analyzing multiple URLs—without slowing down the user experience. It is easily integrated into Django and the developer experience and ecosystem around it is amazing.
Redis
Redis acts as the message broker for Celery and provides caching support. Its lightning-fast performance ensures tasks are queued and processed efficiently. Redis is and has been my go to although I did enjoy RabbitMQ a lot.
PostgreSQL
For the database, I chose PostgreSQL, a reliable and feature-rich relational database system. Its advanced capabilities, like full-text search and JSONB support, make it ideal for handling complex data queries. The full-text search works perfect with Django, here is a very detailed post about it.
FastAPI
FastAPI adds speed and flexibility to certain parts of the system, particularly where high-performance APIs are needed. Its modern Python syntax and automatic OpenAPI documentation make it a joy to work with. It is used to decouple the Scraper logic, since I wanted this to be a standalone project called “Scraproxy“.
Playwright
For web scraping and analysis, Playwright is the backbone. It’s a modern alternative to Selenium, offering cross-browser support and powerful features for interacting with websites in a headless (or visible) manner. This ensures that even complex, JavaScript-heavy sites can be accurately analyzed. The killer feature is how easy it is to capture a video and record network activity, which are basically the two main features needed here.
React with Tailwind CSS and shadcn/ui
On the frontend, I use React for building dynamic user interfaces. Paired with TailwindCSS, it enables rapid UI development with a clean, responsive design. shadcn/ui (a component library based on Radix) further enhances the frontend by providing pre-styled, accessible components that align with modern design principles.
This combination of technologies allows Sandkiste.io to be fast, scalable, and user-friendly, handling everything from backend processing to an intuitive frontend experience. Whether you’re inspecting URLs, performing in-depth analysis, or simply navigating the site, this stack ensures a seamless experience. I also have the most experience with React and Tailwind 😁.
Features of Sandkiste.io: What It Can Do
Now that you know the technologies behind Sandkiste.io, let me walk you through what this platform is capable of. Here are the key features that make Sandkiste.io a powerful tool for analyzing and inspecting websites safely and effectively:
Certificate Lookups
One of the fundamental features is the ability to perform certificate lookups. This lets you quickly fetch and review SSL/TLS certificates for a given domain. It’s an essential tool for verifying the authenticity of websites, identifying misconfigurations, or detecting expired or suspicious certificates. We use it a lot to find possibly generated subdomains and to get a better picture of the adversary infrastructure, it helps with recon in general. I get the info from crt.sh, they offer an exposed SQL database for these lookups.
DNS Records
Another key feature of Sandkiste.io is the ability to perform DNS records lookups. By analyzing a domain’s DNS records, you can uncover valuable insights about the infrastructure behind it, which can often reveal patterns or tools used by adversaries.
DNS records provide critical information about how a domain is set up and where it points. For cybersecurity professionals, this can offer clues about:
Hosting Services: Identifying the hosting provider or server locations used by the adversary.
Mail Servers: Spotting potentially malicious email setups through MX (Mail Exchange) records.
Subdomains: Finding hidden or exposed subdomains that may indicate a larger infrastructure or staging areas.
IP Addresses: Tracing A and AAAA records to uncover the IP addresses linked to a domain, which can sometimes reveal clusters of malicious activity.
DNS Security Practices: Observing whether DNSSEC is implemented, which might highlight the sophistication (or lack thereof) of the adversary’s setup.
By checking DNS records, you not only gain insights into the domain itself but also start piecing together the tools and services the adversary relies on. This can be invaluable for identifying common patterns in malicious campaigns or for spotting weak points in their setup that you can exploit to mitigate threats.
HTTP Requests and Responses Analysis
One of the core features of Sandkiste.io is the ability to analyze HTTP requests and responses. This functionality is a critical part of the platform, as it allows you to dive deep into what’s happening behind the scenes when a webpage is loaded. It reveals the files, scripts, and external resources that the website requests—many of which users never notice.
When you visit a webpage, the browser makes numerous background requests to load additional resources like:
JavaScript files
CSS stylesheets
Images
APIs
Third-party scripts or trackers
These requests often tell a hidden story about the behavior of the website. Sandkiste captures and logs every requests. Every HTTP request made by the website is logged, along with its corresponding response. (Jup, we store the raw data as well). For security professionals, monitoring and understanding these requests is essential because:
Malicious Payloads: Background scripts may contain harmful code or trigger the download of malware.
Unauthorized Data Exfiltration: The site might be sending user data to untrusted or unexpected endpoints.
Suspicious Third-Party Connections: You can spot connections to suspicious domains, which might indicate phishing attempts, tracking, or other malicious activities.
Alerts for Security Teams: Many alerts in security monitoring tools stem from these unnoticed, automatic requests that trigger red flags.
Security Blocklist Check
The Security Blocklist Check is another standout feature of Sandkiste.io, inspired by the great work at web-check.xyz. The concept revolves around leveraging malware-blocking DNS servers to verify if a domain is blacklisted. But I took it a step further to make it even more powerful and insightful.
Instead of simply checking whether a domain is blocked, Sandkiste.io enhances the process by using a self-hosted AdGuard DNS server. This server doesn’t just flag blocked domains—it captures detailed logs to provide deeper insights. By capturing logs from the DNS server, Sandkiste.io doesn’t just say “this domain is blacklisted.” It identifies why it’s flagged and where the block originated, this enables me to assign categories to the domains. The overall scores tells you very quickly if the page is safe or not.
Video of the Session
One of the most practical features of Sandkiste.io is the ability to create a video recording of the session. This feature was the primary reason I built the platform—because a single screenshot often falls short of telling the full story. With a video, you gain a complete, dynamic view of what happens during a browsing session.
Static screenshots capture a single moment in time, but they don’t show the sequence of events that can provide critical insights, such as:
Pop-ups and Redirects: Videos reveal if and when pop-ups appear or redirects occur, helping analysts trace how users might be funneled into malicious websites or phishing pages.
Timing of Requests: Understanding when specific requests are triggered can pinpoint what actions caused them, such as loading an iframe, clicking a link, or executing a script.
Visualized Responses: By seeing the full process—what loads, how it behaves, and the result—you get a better grasp of the website’s functionality and intent.
Recreating the User Journey: Videos enable you to recreate the experience of a user who might have interacted with the target website, helping you diagnose what happened step by step.
A video provides a much clearer picture of the target website’s behavior than static tools alone.
How Sandkiste.io Works: From Start to Insight
Using Sandkiste.io is designed to be intuitive and efficient, guiding you through the analysis process step by step while delivering detailed, actionable insights.
You kick things off by simply starting a scan. Once initiated, you’re directed to a loading page, where you can see which tasks (or “workers”) are still running in the background.
This page keeps you informed without overwhelming you with unnecessary technical details.
The Results Page
Once the scan is complete, you’re automatically redirected to the results page, where the real analysis begins. Let’s break down what you’ll see here:
Video Playback
At the top, you’ll find a video recording of the session, showing everything that happened after the target webpage was loaded. This includes:
Pop-ups and redirects.
The sequence of loaded resources (scripts, images, etc.).
Any suspicious behavior, such as unexpected downloads or external connections.
This video gives you a visual recap of the session, making it easier to understand how the website behaves and identify potential threats.
Detected Technologies
Below the video, you’ll see a section listing the technologies detected. These are inferred from response headers and other site metadata, and they can include:
Web frameworks (e.g., Django, WordPress).
Server information (e.g., Nginx, Apache).
This data is invaluable for understanding the website’s infrastructure and spotting patterns that could hint at malicious setups.
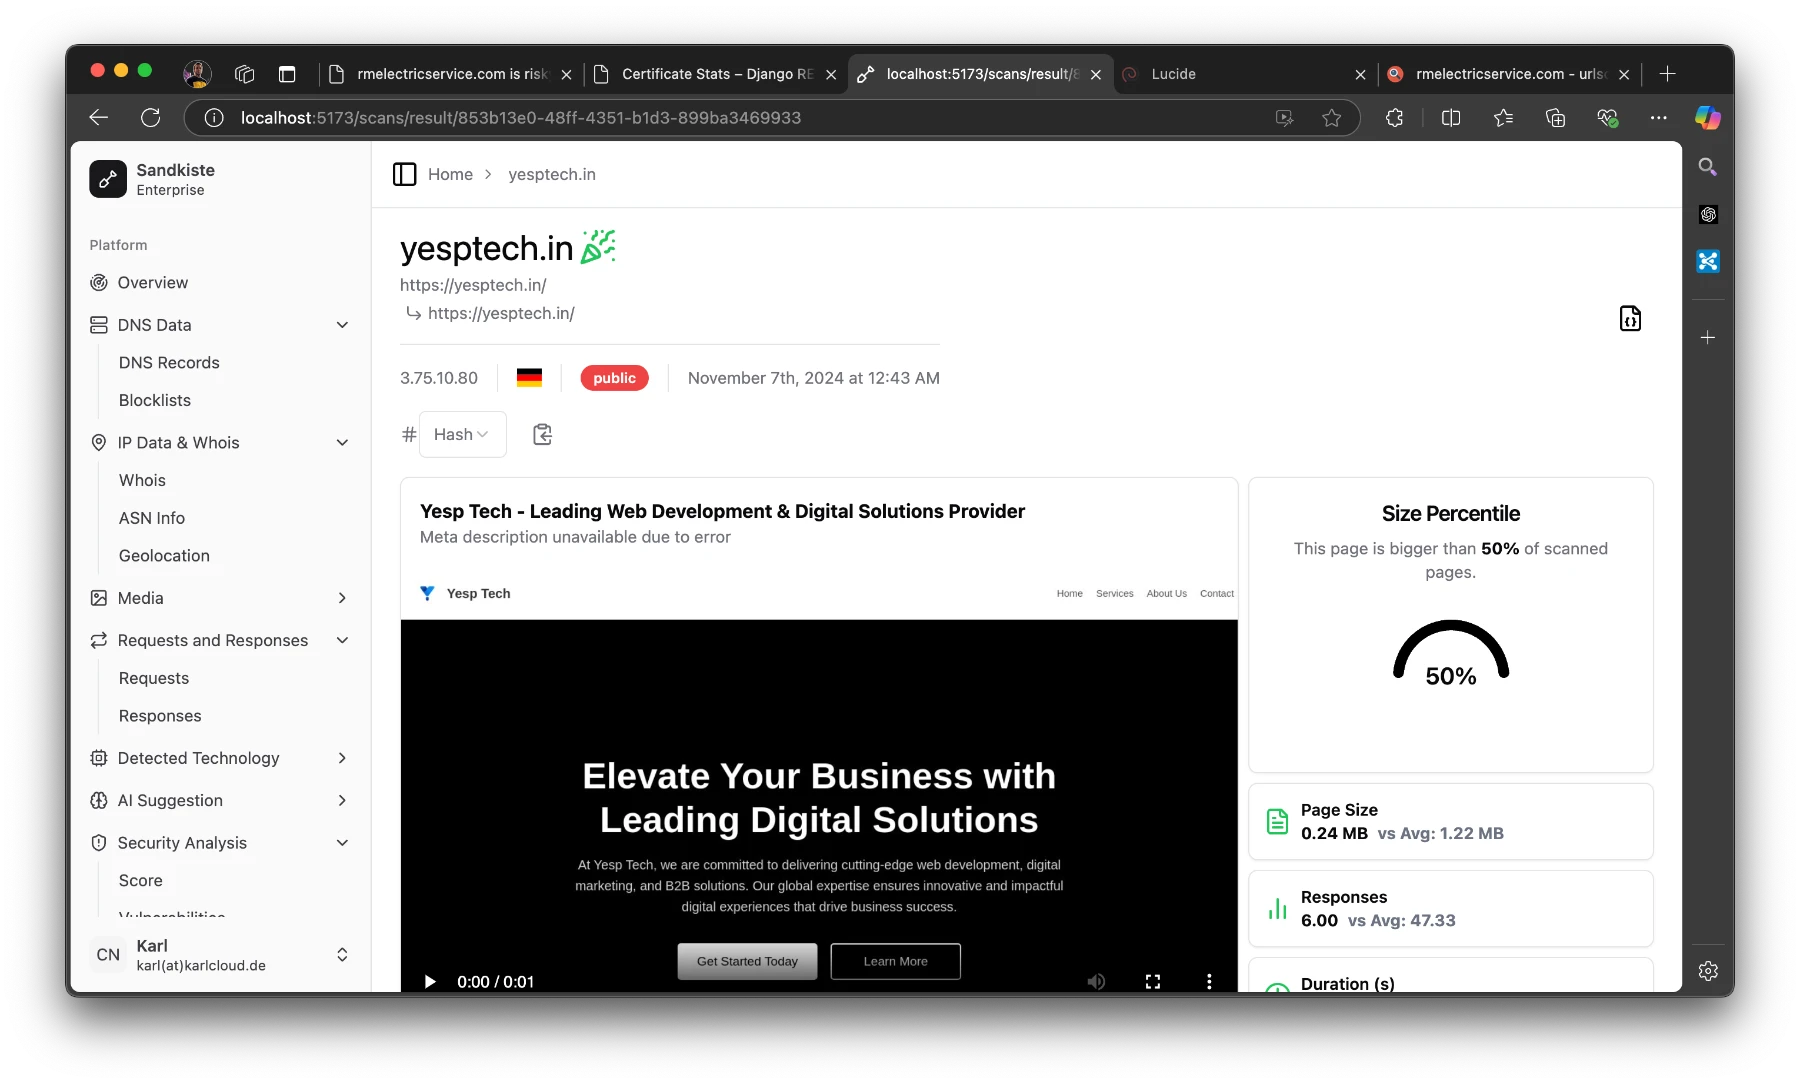
Statistics Panel
On the right side of the results page, there’s a statistics panel with several semi-technical but insightful metrics. Here’s what you can learn:
Size Percentile:
Indicates how the size of the page compares to other pages.
Why it matters: Unusually large pages can be suspicious, as they might contain obfuscated code or hidden malware.
Number of Responses:
Shows how many requests and responses were exchanged with the server.
Why it matters: A high number of responses could indicate excessive tracking, unnecessary redirects, or hidden third-party connections.
Duration to “Network Idle”:
Measures how long it took for the page to fully load and stop making network requests.
Why it matters: Some pages continue running scripts in the background even after appearing fully loaded, which can signal malicious or resource-intensive behavior.
Redirect Chain Analysis:
A list of all redirects encountered during the session.
Why it matters: A long chain of redirects is a common tactic in phishing, ad fraud, or malware distribution campaigns.
By combining these insights—visual evidence from the video, infrastructure details from detected technologies, and behavioral stats from the metrics—you get a comprehensive view of the website’s behavior. This layered approach helps security analysts identify potential threats with greater accuracy and confidence.
At the top of the page, you’ll see the starting URL and the final URL you were redirected to.
“Public” means that others can view the scan.
The German flag indicates that the page is hosted in Germany.
The IP address shows the final server we landed on.
The party emoji signifies that the page is safe; if it weren’t, you’d see a red skull (spooky!). Earlier, I explained the criteria for flagging a page as good or bad.
On the “Responses” page I mentioned earlier, you can take a closer look at them. Here, you can see exactly where the redirects are coming from and going to. I’ve added a red shield icon to clearly indicate when HTTP is used instead of HTTPS.
As an analyst, it’s pretty common to review potentially malicious scripts. Clicking on one of the results will display the raw response safely. In the image below, I clicked on that long JavaScript URL (normally a risky move, but in Sandkiste, every link is completely safe!).
Conclusion
And that’s the story of Sandkiste.io, a project I built over the course of a month in my spare time. While the concept itself was exciting, the execution came with its own set of challenges. For me, the toughest part was achieving a real-time feel for the user experience while ensuring the asynchronous jobs running in the background were seamlessly synced back together. It required a deep dive into task coordination and real-time updates, but it taught me lessons that I now use with ease.
Currently, Sandkiste.io is still in beta and runs locally within our company’s network. It’s used internally by my team to streamline our work and enhance our incident response capabilities. Though it’s not yet available to the public, it has already proven its value in simplifying complex tasks and delivering insights that traditional tools couldn’t match.
Future Possibilities
While it’s an internal tool for now, I can’t help but imagine where this could go.
For now, Sandkiste.io remains a testament to what can be built with focus, creativity, and a drive to solve real-world problems. Whether it ever goes public or not, this project has been a milestone in my journey, and I’m proud of what it has already achieved. Who knows—maybe the best is yet to come!
If you deployed Nginx Proxy Manager via Docker in your home directory you can edit this file with
nano~/data/nginx/custom/http.conf
All you need to do is add the following at the top:
http.conf
more_set_headers'Server: CuteKitten';
Then, restart your Nginx Proxy Manager. If you’re using Docker, like I am, a simple docker compose restart will do the trick.
With this, the custom Server header will be applied to every request, including those to the Nginx Proxy Manager UI itself. If you check the response headers of this website, you’ll see the header I set—proof of how easy and effective this customization can be!
Understanding more_set_headers vs add_header
When working with Nginx Proxy Manager, you may encounter two ways to handle HTTP headers:
add_header
more_set_headers
What is add_header?
add_header is a built-in Nginx directive that allows you to add new headers to your HTTP responses. It’s great for straightforward use cases where you just want to include additional information in your response headers.
What is more_set_headers?
more_set_headers is part of the “headers_more” module, an extension not included in standard Nginx but available out of the box with Nginx Proxy Manager(since it uses OpenResty). This directive gives you much more flexibility:
It can add, overwrite, or remove headers entirely.
It works seamlessly with Nginx Proxy Manager, so there’s no need to install anything extra.
You don’t need to modify or remove existing headers.
Example:
add_header X-Frame-OptionsSAMEORIGIN;
Use more_set_headers if:
You need to replace or remove existing headers, such as Server or X-Powered-By.
You want headers to apply to all responses, including error responses (e.g., 404, 500).
Example:
# Replace the default Nginx Server headermore_set_headers "Server: MyCustomServer";
Why Use more_set_headers?
The key advantage of more_set_headers is that it provides full control over your headers. For example:
If you want to customize the Server header, add_header won’t work because the Server header is already set internally by Nginx, you would have to remove it first.
more_set_headers can replace the Server header or even remove it entirely, which is particularly useful for security or branding purposes.
Since Nginx Proxy Manager includes the headers_more module by default, using more_set_headers is effortless and highly recommended for advanced header management.
A Note on Security
Many believe that masking or modifying the Server header improves security by hiding the server software you’re using. The idea is that attackers who can’t easily identify your web server (e.g., Nginx, Apache, OpenResty) or its version won’t know which exploits to try.
While this may sound logical, it’s not a foolproof defense:
Why It May Be True: Obscuring server details could deter opportunistic attackers who rely on automated tools that scan for specific server types or versions.
Why It May Be False: Determined attackers can often gather enough information from other headers, server behavior, or fingerprinting techniques to deduce what you’re running, regardless of the Server header.
Ultimately, changing the Server header should be seen as one small layer in a broader security strategy, not as a standalone solution. Real security comes from keeping your software updated, implementing proper access controls, and configuring firewalls—not just masking headers.
Hey there, server samurais and cyber sentinels! Ready to transform your Debian server into an impregnable fortress? Whether you’re a seasoned sysadmin or a newbie just dipping your toes into the world of server security, this guide is your one-stop shop for all things safety on the wild, wild web. Buckle up, because we’re about to embark on a journey full of scripts, tips, and jokes to keep things light and fun. There are many good guides on this online, I decided to add another one with the things I usually do. Let’s dive in!
Initial Setup: The First Line of Defense
Imagine setting up your server like moving into a new house. You wouldn’t leave the door wide open, right? The same logic applies here.
Update Your System
Outdated software is like a welcome mat for hackers. Run the following commands to get everything current:
Bash
sudoaptupdate && sudoaptupgrade-y
Create a New User
Root users are like the king of the castle. Let’s create a new user with sudo privileges:
SSH (Secure Shell) is the key to your castle gates. Leaving it unprotected is like leaving the keys under the doormat.
Disable Root Login
Edit the SSH configuration file:
Bash
sudonano/etc/ssh/sshd_config
Change PermitRootLogin to no:
Bash
PermitRootLoginno
Change the Default SSH Port
Edit the SSH configuration file:
Bash
sudonano/etc/ssh/sshd_config
Change the port to a number between 1024 and 65535 (e.g., 2222):
Bash
Port2222
Restart the SSH service:
Bash
sudosystemctlrestartssh
There is actually some controversy about security through obscurity, in my long tenure as an analyst and incident responser I believe less automated “easy” attacks do improve security.
Set Up SSH Keys
Generate a key pair using elliptic curve cryptography:
Again there is also some controversy about this. Most people are afraid that they wake up one night and all their servers are down, because a botched automated update. In my non-professional live with my home IT, this has never happened and even professionally, if we are just talking security updates of an OS like Debian, I haven’t seen it, yet.
User Management: Only the Knights in the Realm
Not everyone needs the keys to the kingdom. Ensure only trusted users have access. On a fresh install probably unnecessary, but good housekeeping.
Even the best fortress can be breached. Regular backups ensure you can recover from any disaster.
Full disclosure: I have had a very bad data loss experience with rsync and have since switched to Borg. I can also recommend restic. This had nothing to do with rsync in itself, rather how easy it is to mess up.
Install rsync
rsync is a powerful tool for creating backups. Install it with:
For longer backup jobs you should switch to a service with timer rather than cron. Here is a post from another blog about it. Since my data has grown to multiple terabyte this is what I do now too
Advanced Security Best Practices
Enable Two-Factor Authentication (2FA)
Adding an extra layer of security with 2FA can significantly enhance your server’s protection. Use tools like Google Authenticator or Authy. I had this on an Ubuntu server for a while and thought it was kind of cool.
Congratulations, noble guardian! You’ve fortified your Debian server into a digital fortress. By following these steps, you’ve implemented strong security practices, ensuring your server is well-protected against common threats. Remember, security is an ongoing process, and staying vigilant is key to maintaining your kingdom’s safety.
Happy guarding, and may your server reign long and prosper!
Welcome back to the second installment of our exploration into Certspotter and the world of passive reconnaissance. In Part 1, we laid the groundwork for understanding the significance of Certspotter as a vital tool in monitoring certificate transparency logs. We delved into the nuances of passive reconnaissance, highlighting the importance of discreet operations in gathering intelligence without alerting targets.
Now, in Part 2, we’re ready to dive even deeper. Building upon the foundation established in Part 1, we’ll explore advanced techniques for leveraging Certspotter’s capabilities to their fullest potential. Our focus will be on enriching the data obtained from Certspotter and enhancing our reconnaissance efforts through the integration of additional tools and methodologies.
Join me as I uncover the untapped potential of Certspotter and embark on a journey to uncover valuable insights that will inform and empower your hacking strategies. Let’s dive in and elevate our reconnaissance game to new heights.
Data Enrichment
So, you’ve already gathered a wealth of information about your target. But let’s take it a step further.
Here’s what you want to know:
What’s running on the new subdomain?
Any interesting paths?
Open ports?
Can we capture a screenshot?
Are there any potential vulnerabilities?
Perhaps you have a custom target, like specifically testing for WordPress.
Now, there might be a tool out there that handles all these tasks, but I haven’t found it yet. (Feel free to shoot me a message on Signal if you know one). Instead, I’ve decided to build a tool together with you, right here, right now, leveraging ProjectDiscovery’s Tools, which are awesome open-source projects written in one of my favorite languages: Go.
However, as we transition from passive to active reconnaissance, I must reiterate the importance of reading my disclaimer.
Web Technology:
For this task, we’ll use a tool called Webanalyze.
Now, a quick note: I’m not authorized to recon sandbox.google.com. If, by chance, any of my tools cause a denial of service state on the endpoint, I might be held liable for damages.
To demonstrate, I whitelisted my IP and scanned my own website:
For further consumption I suggest using -output json and storing it locally or sending it to your central system.
Screenshot
For this task, we’ll utilize playwright. While some might argue that this is overkill, I have some future plans in mind. You can learn more about playwright here.
Bash
npminitplaywright@latest
Simply respond with “yes” to all the prompts, as having a positive attitude is always beneficial.
Below is a script that captures a full-page screenshot and lists all the network calls made by a loaded page:
JavaScript
const { chromium } =require("playwright");(async () => {// Launch browserconstbrowser=await chromium.launch();// Create a new pageconstpage=await browser.newPage();// Enable request interceptionawait page.route("**", (route) => { console.log(route.request().url()); route.continue(); });// Navigate to the desired pageawait page.goto("https://exploit.to");// Take a full-page screenshotawait page.screenshot({ path: "exploit.png", fullPage: true });// Close the browserawait browser.close();})();
Here’s how you can run the script and check its output:
Understanding the open ports on a target system can provide valuable insights into its network architecture and potential vulnerabilities. To accomplish this, we’ll conduct a quick scan using nmap, a powerful network scanning tool.
Bash
sudonmap-sS-Pn-T4exploit.to
This command initiates a SYN scan (-sS) without host discovery (-Pn) at an aggressive timing level (-T4) against the target exploit.to.
Exploring subdomains can uncover hidden entry points and potential vulnerabilities within a target’s infrastructure. Let’s leverage Subfinder for passive subdomain enumeration and HTTPX for validation.
Here’s a basic setup, but you can fine-tune these flags extensively. Additionally, I recommend integrating free API Keys to enhance subdomain discovery.
In our hypothetical Google case, here are some findings:
Now, let’s delve into fuzzing some paths. While tools like Gobuster can handle both subdomain enumeration and directory enumeration, I’d like to showcase some different tools for this task.
These results provide insights into various paths on the target site, facilitating potential avenues for further exploration and potential vulnerabilities.
Vulnerabilities
Vulnerability scanners are notorious for their loud presence, and we have several options at our disposal:
Running Nuclei with all available templates can uncover a plethora of issues. However, be cautious, as this scan can be aggressive. Here’s an example scan of my website. Note that running such a scan on unauthorized targets is not recommended:
Let’s break down some of the identified vulnerabilities from the Nuclei scan results:
nameserver-fingerprint [dns]: This vulnerability detection identifies the nameservers associated with the domain exploit.to, revealing that it is using Cloudflare’s nameservers (jonah.ns.cloudflare.com and uma.ns.cloudflare.com). While not necessarily a vulnerability, this information can be useful for reconnaissance purposes.
caa-fingerprint [dns]: This indicates the absence of CAA (Certificate Authority Authorization) records for the domain exploit.to. CAA records specify which certificate authorities are allowed to issue certificates for a domain. Lack of CAA records might imply less control over certificate issuance, potentially leaving the domain vulnerable to unauthorized certificate issuance.
dmarc-detect [dns]: This detection reveals the DMARC (Domain-based Message Authentication, Reporting, and Conformance) policy for the domain _dmarc.exploit.to. The policy specifies how a receiving mail server should handle emails that fail SPF (Sender Policy Framework) and DKIM (DomainKeys Identified Mail) checks. In this case, the policy is set to “reject,” indicating strict handling of failed authentication, which is generally considered good practice.
mx-fingerprint [dns]: This vulnerability detection identifies the mail servers (MX records) associated with the domain exploit.to, which are provided by Cloudflare. While not necessarily a vulnerability, this information can be useful for understanding the email infrastructure associated with the domain.
txt-fingerprint [dns]: This reveals the SPF (Sender Policy Framework) record for the domain exploit.to, specifying which servers are allowed to send emails on behalf of the domain. The record indicates that emails should be sent only from servers included in the _spf.mx.cloudflare.net include mechanism.
waf-detect:cloudflare [http]: This detection indicates the presence of a WAF (Web Application Firewall) provided by Cloudflare for the domain exploit.to. WAFs help protect web applications from common security threats such as SQL injection, cross-site scripting (XSS), and DDoS attacks.
ssl-issuer [ssl]: This reveals information about the SSL certificate issuer for the domain exploit.to, which is Google Trust Services LLC. SSL certificates issued by reputable authorities help establish secure HTTPS connections, ensuring data transmitted between the user’s browser and the web server remains encrypted and secure.
These are just a few examples of the vulnerabilities and configurations identified in the Nuclei scan results. Each of these findings provides valuable insights into potential security risks and areas for improvement in the domain’s infrastructure and configuration.
Imagine you’re interested in scanning for Elastipot, Elasticsearch honeypots. Identifying these honeypots beforehand can be crucial before launching any new zero-day attack on open Elasticsearch instances. While creating custom templates for such detections isn’t overly complicated, it allows you to tailor detection scripts to your specific needs. Alternatively, you can employ Gobuster, as mentioned earlier, to test for specific paths.
Recon Data
We’ve successfully gathered all the desired data:
Identification of services running on new subdomains.
Open ports analysis.
Screenshot capture.
Discovery of interesting paths.
Identification of possible vulnerabilities.
Custom targeting, such as explicit testing for WordPress.
We now know that our target is developing a new project, the technolgies used, possible vulnerabilities, interesting paths, have a screenshot and more.
Summary
We explored various reconnaissance techniques, from subdomain enumeration and directory scanning to vulnerability assessments and customized detections. Leveraging tools like Certspotter, Gobuster, Nuclei, and others, we gained profound insights into our target’s infrastructure and potential security vulnerabilities.
Our adventure began with an introduction to Certspotter, the pioneer in certificate transparency log monitoring. We dissected the significance of passive reconnaissance, emphasizing its discreet nature compared to active methods. With Certspotter, we learned how to continuously monitor for new subdomains and certificate registrations, all at minimal cost.
From envisioning scenarios of seizing control over freshly set up WordPress sites to stealthily infiltrating default credentials in Grafana or Jenkins installations, the possibilities for mischief are boundless. Armed with our newfound knowledge and toolkit, the next logical step involves automating these processes and integrating them into a centralized system for ongoing monitoring and analysis.
I am working on a Part 3. In the next part I want to combine all the tools to one final script that should be triggered whenever certspotter finds a new certificate:
Certspotter stands as the original authority in certificate transparency log monitoring—a mouthful, indeed. Let’s dissect why you, as a hacker, should pay attention to it.
One of your primary maneuvers when targeting a system is reconnaissance, particularly passive reconnaissance. Unlike active reconnaissance, which directly engages the target, passive recon operates discreetly.
Passive recon involves employing tactics that evade triggering any alerts from the target. For instance, conducting a Google search about your target doesn’t tip them off. While technically they might detect someone from your area or country searching for them via Search Console, using a VPN and a private browser can easily circumvent this.
You can even explore their entire website using Google cache (just search for cache:your-target.com) or archive.org without exposing your IP or intentions to them. On the other hand, active recon tends to be more assertive, such as port scanning, which leaves traces in the target’s logs. Depending on their security measures and level of vigilance, they might notice and decide to block you.
If you were to scan my public IP, I’d promptly block you 😃.
But I digress. What if you could continuously and passively monitor your target for new subdomains, project developments, systems, or any other endeavors that require a certificate? Imagine being alerted right as they register it.
Now, you might wonder, “How much will that cost me?” Surprisingly, nothing but the electricity to power your server or whatever charges your cloud provider levies. With Certspotter, you can scrutinize every certificate issued to your target’s domains and subdomains.
What mischief can I stir?
Your mind is probably already concocting schemes, so here’s a scenario to fuel your imagination:
Imagine your target sets up a WordPress site requiring an admin password upon the first visit. You could swoop in ahead of them, seizing control of their server. (Sure, they might reinstall, but it’ll definitely ruffle their feathers 😏).
A bit sneakier? How about adding a covert admin account to a fresh Grafana or Jenkins installation, which might still be using default credentials upon release. Truly, you never know what you might uncover.
Setting up Certspotter
To begin, you’ll need a fresh Debian-based Linux distro. I’ll opt for Kali to simplify later use of other hacking tools. Alternatively, you can choose any Linux distribution to keep your image size compact.
Certspotter
Start by visiting their Certspotter GitHub. I strongly advise thoroughly reading their documentation to acquaint yourself with the tool.
Prefixing a domain with a . signifies monitoring the domain and all its subdomains. Without the prefix, Certspotter will monitor certificates matching the exact domain/subdomain.
I can anticipate your next thought—you want all the logs, don’t you? Since 2013, there have been 7,485,653,605 of them (Source), requiring substantial storage. If you’re undeterred, you’d need to modify this code here and rebuild Certspotter to bypass the watchlist and retrieve everything.
Now, let’s set up the systemd service. Here’s how mine looks:
Bash
sudonano/etc/systemd/system/certspotter.service
You’ll need to adjust the paths unless your username is also karl:
Note: I’m currently not utilizing the -start_at_end flag. As a result, my script begins its operation from the initial point and might take a considerable amount of time to detect recently issued certificates. By modifying the line that begins with ExecStart= and adding the -start_at_end parameter to the certspotter command, you instruct the script to disregard previously issued certificates and commence monitoring from the current time onward.
Depending on your target, it will take a while until you see results. Maybe even days.
Summary
In this first part of our exploration into Certspotter, we’ve laid the groundwork for understanding its significance in passive reconnaissance. Certspotter emerges as a pivotal tool in monitoring certificate transparency logs, enabling hackers to gather crucial intelligence without alerting their targets.
We’ve delved into the distinction between passive and active reconnaissance, emphasizing the importance of discreet operations in avoiding detection. Through Certspotter, hackers gain the ability to monitor target domains and subdomains continuously, staying informed about new developments and potential vulnerabilities.
As we conclude Part 1, we’ve only scratched the surface of what Certspotter has to offer. In Part 2, we’ll dive deeper into advanced techniques for leveraging Certspotter’s capabilities, exploring tools to enrich our data and enhance our reconnaissance efforts. Stay tuned for an in-depth exploration of Certspotter’s potential in uncovering valuable insights for hackers.
Ever found yourself deep in the abyss of the internet, wishing you could uncover more than what’s on the surface? If so, Google Hacking, also known as Google Dorking, might just be your next favorite hobby. This amusing and surprisingly potent skill will turn you into an internet sleuth, uncovering secrets like a digital Sherlock Holmes. By the end of this article, you’ll be ready to create your own Google dorks and impress (or mildly concern) your friends with your newfound abilities.
If you’re interested in OSINT in general you can also check out my other articles:
Google Hacking , whcih is also called Google Dorking, is the playful art of using Google’s search engine to uncover sensitive information that wasn’t meant for public eyes. From personal data and financial info to website security flaws, Google Hacking can reveal it all. But don’t panic—it’s perfectly legal as long as you don’t misuse the info you stumble upon.
To break it down a bit, Google Hacking isn’t some kind of sorcery. It’s about finding anything that’s been indexed by Google or other major search engines. With the right search queries, you can dig up info that’s not ranking high on Google—often the kind of stuff that wasn’t meant to be easily found. So go ahead, have fun, and happy Googling (responsibly)!
Why the Term “Dorking”?
“Dork” in this context refers to a set of search parameters that expose unprotected information. Think of it as a key that unlocks hidden doors on the internet. The term “dorking” might sound silly, but the results can be pretty serious.
Tools of the Trade
Before we dive into the nitty-gritty, let’s talk about the essential tools and resources you’ll need:
Google Advanced Search Operators: These are special commands you can use in Google’s search bar to filter results more precisely. You can find a comprehensive list of these operators on Ahrefs’ blog.
Google Hacking Database (GHDB): A treasure trove of pre-made Google dorks. Check out the database on Exploit-DB to see what others have discovered.
Alternative Search Engines: Bing, DuckDuckGo, and Startpage also offer advanced search capabilities. Explore their documentation on Bing (and this), DuckDuckGo, and Startpage.
Pro tip: You can use Dorks from Exploit-DB to play around with them and create new dorks focued on your target or niche.
The Basics of Google Dorking
I will focus on Google here as it is the biggest search engine and will usually give you some solid results. Let’s start with some simple Google search operators:
site: – Restrict results to a specific website.
Example: site:example.com
filetype: – Search for specific file types.
Example: filetype:pdf
inurl: – Find URLs containing specific text.
Example: inurl:login
intitle: – Search for page titles containing specific text.
Example: intitle:index.of
Combining these operators can yield powerful results. For instance, to find login pages on example.com, you could use: site:example.com inurl:login
Let’s do another example searching a webiste for a contact email address (or to send them phishing mails (pls don’t)): "@cancom.de" site:"cancom.de"
Useful dorks to get started
Now for some fun! Here are a few beginner-friendly dorks, please feel free to copy and modify them to your liking:
Finding Open Directories:
intitle:"index of" "parent directory"
Discovering Public Cameras:
intitle:"Live View / - AXIS"
Uncovering Interesting PDFs:
filetype:pdf "confidential"
Locating Forgotten Passwords:
filetype:log inurl:"password"
Creating Your Own Dorks
Creating your own Google dorks is like cooking a new dish—start with the basics and experiment. Here’s a step-by-step guide:
Identify Your Target: Decide what type of information you’re seeking. Is it emails, passwords, or hidden directories?
Choose the Right Operators: Based on your target, select appropriate search operators.
Example: To find Excel files with passwords, you might use filetype:xls inurl:password.
Test and Refine: Enter your dork into Google and see what comes up. Refine your search terms to get more relevant results.
Document Your Findings: Keep a record of effective dorks for future reference. You never know when you might need them again!
You can combine many operators to refine your results.
Final Thoughts
Hooray! You’ve officially unlocked the secrets of Google Dorking. Get ready to dive deeper in the next part, where I’ll dish out more details and examples about other search engines and why they’re worth your time too. But before we move on, here are a few ways to flex your new skills:
Become a Digital Bounty Hunter: Track down elusive individuals like a pro (In the U.S. you can check your states State Trooper website fpr active bounties).
Debt Detective: Find those who owe you money faster than a speeding algorithm.
Hack the Planet: Discover websites with vulnerable software
Doxing – Beyond the usual “it’s illegal” disclaimer, doxing can irreversibly ruin someone’s life. Trust me, no matter how much you dislike someone, you do not want to go down this path.
Find pirated Software
Stay tuned, because your Google Dorking journey is just getting started!
Welcome to a journey through the exciting world of Open Source Intelligence (OSINT) tools! In this post, we’ll dive into some valuable tools, from the lightweight to the powerhouse, culminating in the grand reveal of Spiderfoot.
The main star of this post is Spiderfoot, but before we get there, I want to show you some other more lightweight tools you might find useful.
Holehe
While perusing one of my favorite OSINT blogs (Oh Shint), I stumbled upon a gem to enhance my free OSINT email tool: Holehe.
Holehe might seem like a forgotten relic to some, but its capabilities are enduring. Developed by megadose, this tool packs a punch when it comes to unearthing crucial information.
Sherlock
Ah, Sherlock – an old friend in my toolkit. I’ve relied on this tool for countless investigations, probably on every single one. The ability to swiftly uncover and validate your targets’ online presence is invaluable.
Sherlock’s prowess lies in its efficiency. Developed by Sherlock Project, it’s designed to streamline the process of gathering information, making it a staple for OSINT enthusiasts worldwide.
Introducing Holehe
First up, let’s shine a spotlight on Holehe, a tool that might have slipped under your radar but packs a punch in the OSINT arena.
Easy Installation
Getting Holehe up and running is a breeze. Just follow these simple steps bewlo. I quickly hopped on my Kali test machine and installed it:
I’d recommend installing it with Docker, but since I reinstall my demo Kali box every few weeks, it doesn’t matter that I globally install a bunch of Python libraries.
I used the --no-clear flag so I can just copy my executed command; otherwise, it clears the terminal. I use the --only-used flag because I only care about pages that my target uses.
Sweet! We have a hit! Holehe checked 121 different pages in 10.16 seconds.
Debugging Holehe
So running the tool without the --only-used flag is, in my opinion, important for debugging. It seems that a lot of pages rate-limited me or are throwing errors. So there is a lot of potential of missed accounts here.
the list is very long so I removed a lot of the output
Personally, I think that since a lot of that code is 2 years old, many of these pages have become a lot smarter about detecting bots, which is why the rate limit gets reached.
Holehe Deep Dive
Let us look at how Holehe works by analyzing one of the modules. I picked Codepen.
Please check out the code. I added some comments:
Python
from holehe.core import*from holehe.localuseragent import*asyncdefcodepen(email, client, out): name ="codepen" domain ="codepen.io" method ="register" frequent_rate_limit =False# adding necessary headers for codepen signup request headers = {"User-Agent": random.choice(ua["browsers"]["chrome"]),"Accept": "*/*","Accept-Language": "en,en-US;q=0.5","Referer": "https://codepen.io/accounts/signup/user/free","Content-Type": "application/x-www-form-urlencoded; charset=UTF-8","X-Requested-With": "XMLHttpRequest","Origin": "https://codepen.io","DNT": "1","Connection": "keep-alive","TE": "Trailers", }# getting the CSRF token for later use, adding it to the headerstry: req =await client.get("https://codepen.io/accounts/signup/user/free", headers=headers ) soup = BeautifulSoup(req.content, features="html.parser") token = soup.find(attrs={"name": "csrf-token"}).get("content") headers["X-CSRF-Token"] = tokenexceptException: out.append( {"name": name,"domain": domain,"method": method,"frequent_rate_limit": frequent_rate_limit,"rateLimit": True,"exists": False,"emailrecovery": None,"phoneNumber": None,"others": None, } )returnNone# here is where the supplied email address is added data = {"attribute": "email", "value": email, "context": "user"}# post request that checks if account exists response =await client.post("https://codepen.io/accounts/duplicate_check", headers=headers, data=data )# checks response for specified text. If email is taken we have a hitif"That Email is already taken."in response.text: out.append( {"name": name,"domain": domain,"method": method,"frequent_rate_limit": frequent_rate_limit,"rateLimit": False,"exists": True,"emailrecovery": None,"phoneNumber": None,"others": None, } )else:# we land here if email is not taken, meaning no account on codepen out.append( {"name": name,"domain": domain,"method": method,"frequent_rate_limit": frequent_rate_limit,"rateLimit": False,"exists": False,"emailrecovery": None,"phoneNumber": None,"others": None, } )
The developer of Holehe had to do a lot of digging. They had to manually analyze the signup flow of a bunch of different pages to build these modules. You can easily do this by using a tool like OWASP ZAP or Burp Suite or Postman. It is a lot of manual work, though.
The issue is that flows like this often change. If Codepen changed the response message or format, this code would fail. That’s the general problem with building web scrapers. If a header name or HTML element is changed, the code fails. This sort of code is very hard to maintain. I am guessing it is why this project has been more or less abandoned.
Nonetheless, you could easily fix the modules, and this would work perfectly again. I suggest using Python Playwright for the requests; using a headless browser is harder to detect and will probably lead to higher success.
Sherlock
Let me introduce you to another tool called Sherlock, which I’ve frequently used in investigations.
Installation
I’m just going to install it on my test system. But there’s also a Docker image I’d recommend for a production server:
Sherlock offers a plethora of options, and I recommend studying them for your specific case. It’s best used with usernames, but today, we’ll give it a try with an email address.
At first glance, there are a lot more results. However, upon review, only 2 were valid, which is still good considering this tool is normally not used for email addresses.
Sherlock Deep Dive
Sherlock has a really nice JSON file that can easily be edited to add or remove old tools. You can check it out sherlock/resources/data.json.
This makes it a lot easier to maintain. I use the same approach for my OSINT tools here on this website.
This is what one of Sherlock’s modules looks like:
There’s not much more to it; they basically use these “templates” and test the responses they get from requests sent to the respective endpoints. Sometimes by matching text, sometimes by using regex.
Spiderfoot
Now we get to the star of the show: Spiderfoot. I love Spiderfoot. I use it on every engagement, usually only in Passive mode with just about all the API Keys that are humanly affordable. The only thing I do not like about it is that it actually finds so much information that it takes a while to sort through the data and filter out false positives or irrelevant data. Playing around with the settings can drastically reduce this.
Installation
Spiderfoot is absolutely free and even without API Keys for other services, it finds a mind-boggling amount of information. It has saved me countless hours on people investigations, you would not believe it.
You can find the installation instructions on the Spiderfoot GitHub page. There are also Docker deployments available for this. In my case, it is already pre-installed on Kali, so I just need to start it.
Bash
spiderfoot-l0.0.0.0:8081
This starts the Spiderfoot webserver, and I can reach it from my network on the IP of my Kali machine on port 8081. In my case, that would be http://10.102.0.11:8081/.
After you navigate to the address, you will be greeted with this screen:
I run a headless Kali, so I just SSH into my Kali “server.” If you are following along, you can simply run spiderfoot -l 127.0.0.1:8081 and only expose it on localhost, then browse there on your Kali Desktop.
Running Spiderfoot
Spiderfoot is absolutely killer when you add as many of the API Keys as possible. A lot of them are for free. Just export the Spiderfoot.cfg from the settings page, fill in the keys, then import them.
Important: before you begin, check the settings. Things like port scans are enabled by default. Your target will know you are scanning them. By default, this is not a passive recon tool like the others. You can disable them OR just run Spiderfoot in Passive mode when you configure a new scan.
My initial scan did not find many infos, that’s good. The email address I supplied should be absolutely clean. I did want to show you some results, so I started another search with my karlcom.de domain, which is my consulting company.
By the time the scan was done, it had found over 2000 results linking Karlcom to Exploit and a bunch of other businesses and websites I run. It found my clear name and a whole bunch of other interesting information about what I do on the internet and how things are connected. All that just by putting my domain in without ANY API keys. That is absolutely nuts.
You get a nice little correlation report at the end (you do not really need to see all the things in detail here):
Once you start your own Spiderfoot journey, you will have more than enough time to study the results there and see them as big as you like.
Another thing I did not show you was the “Browse” option. While a scan is running, you can view the results in the web front end and already check for possible other attack vectors or information.
Summary
So, what did we accomplish on our OSINT adventure? We took a spin through some seriously cool tools! From the nifty Holehe to the trusty Sherlock and the mighty Spiderfoot, each tool brings its own flair to the table. Whether you’re sniffing out secrets or just poking around online, these tools have your back. With their easy setups and powerful features, Holehe, Sherlock, and Spiderfoot are like the trusty sidekicks you never knew you needed in the digital world.
Keep exploring, stay curious, and until next time!
Manage Consent
To provide the best experiences, we use technologies like cookies to store and/or access device information. Consenting to these technologies will allow us to process data such as browsing behavior or unique IDs on this site. Not consenting or withdrawing consent, may adversely affect certain features and functions.
Functional
Always active
The technical storage or access is strictly necessary for the legitimate purpose of enabling the use of a specific service explicitly requested by the subscriber or user, or for the sole purpose of carrying out the transmission of a communication over an electronic communications network.
Preferences
The technical storage or access is necessary for the legitimate purpose of storing preferences that are not requested by the subscriber or user.
Statistics
The technical storage or access that is used exclusively for statistical purposes.The technical storage or access that is used exclusively for anonymous statistical purposes. Without a subpoena, voluntary compliance on the part of your Internet Service Provider, or additional records from a third party, information stored or retrieved for this purpose alone cannot usually be used to identify you.
Marketing
The technical storage or access is required to create user profiles to send advertising, or to track the user on a website or across several websites for similar marketing purposes.