Today I’m showing you a few flows I use to quickly spin up Hetzner servers, run a task, and then tear them back down before they start charging rent.
I use Node-RED as my orchestrator, but honestly, you could do this in any language that can talk to an API. If you prefer Python, Go, or even Bash wizardry – go wild.
For the curious (or those who don’t trust random screenshots on the internet), the official Hetzner Cloud API docs are here: Hetzner Docs.
If you want to learn more about Node-RED go: Node-RED Docs
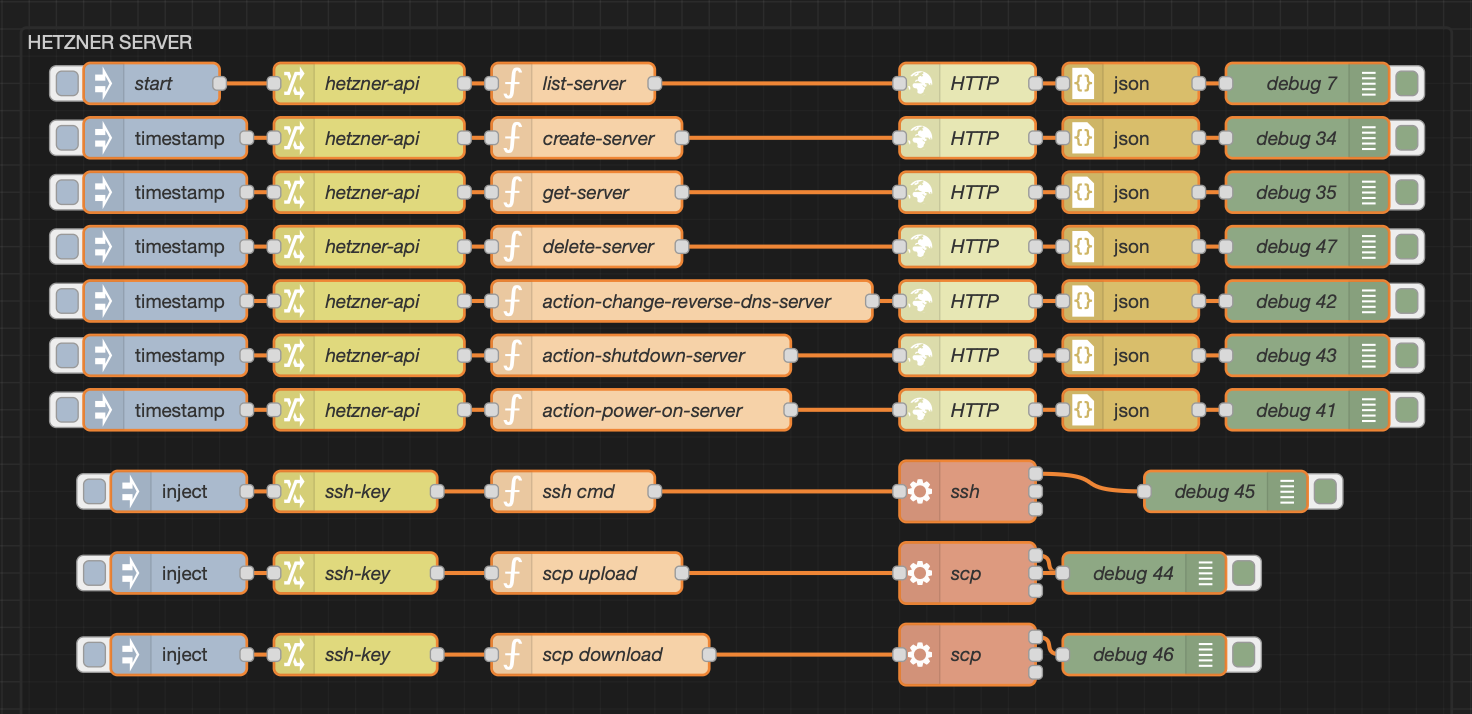
The Nodes
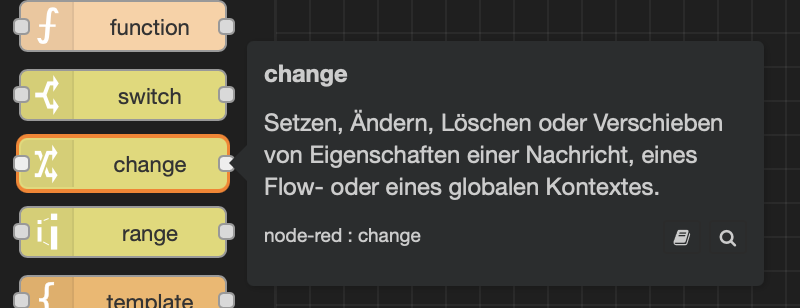
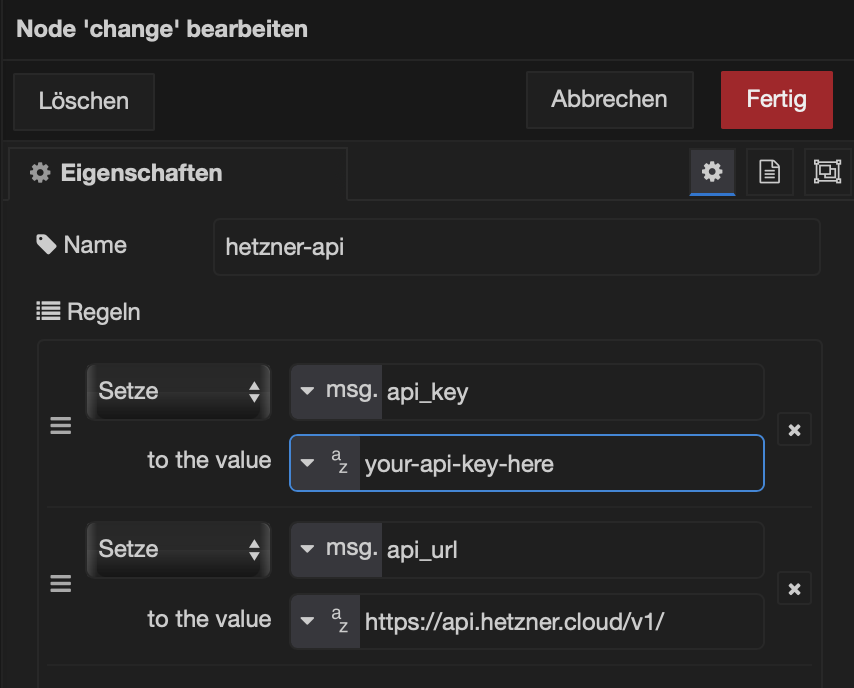
In my Change node, I usually stash constants like the API key and the API URL. That way I don’t have to scatter them across the flow like digital confetti. Keep it neat, keep it simple.
In the Function node is where the real magic happens. Unlike the Change node, the Function node carries a lot more logic. Don’t just skim it, read the comments. They’re basically the map through the jungle:
msg.user_name = "karl" // <- this is the user of your server
msg.server_name = "malware-3" // <- name of the serve ron Hetzner

// Next is the pre-install script, this installs a bunch
// of tools i need
// I add some basic hardening like:
// - no root login, no password login
// - other SSH port
const userData = `#cloud-config
users:
  - name: ${msg.user_name}
    groups: users, admin
    sudo: ALL=(ALL) NOPASSWD:ALL
    shell: /bin/bash
    ssh_authorized_keys:
      - ssh-ed25519 SOMEKEYHERE [email protected]
write_files:
  - path: /etc/ssh/sshd_config.d/ssh-hardening.conf
    content: |
      PermitRootLogin no
      PasswordAuthentication no
      Port 2222
      KbdInteractiveAuthentication no
      ChallengeResponseAuthentication no
      MaxAuthTries 99
      AllowTcpForwarding no
      X11Forwarding no
      AllowAgentForwarding no
      AuthorizedKeysFile .ssh/authorized_keys
      AllowUsers ${msg.user_name}
package_update: true
package_upgrade: true
packages:
  - fail2ban
  - ufw
  - apt-transport-https
  - ca-certificates
  - curl
  - zip
  - gnupg
  - lsb-release
  - software-properties-common
runcmd:
  - ufw allow 2222/tcp
  - ufw enable
  - curl -fsSL https://get.docker.com -o get-docker.sh
  - sh get-docker.sh
  - systemctl enable docker
  - systemctl start docker
  - apt upgrade -y
  - docker --version
  - docker compose version
  - reboot
`;


// this sets up the HTTP-Request node
msg.method = "POST"
msg.url = msg.api_url + "servers"
msg.headers = {
  "Authorization": "Bearer " + msg.api_key,
  "Content-Type": "application/json"
};

// actual API call body
msg.payload = {
  "name": msg.server_name,
  "location": "hel1", // Helsinki Datacenter
  "server_type": "cax11", // smallest ARM server on Hetzner
  "start_after_create": true,
  "image": "debian-13", // OS
  "ssh_keys": [
    "karl-ssh-key"
  ],
  "user_data": userData,
  "labels": {
    "environment": "prod" // <- i like to put prod on my workers
  },
  "automount": false,
  "public_net": {
    "enable_ipv4": true,
    "enable_ipv6": false
  }
};

return msg;
⏱️ Setup time: About 10 minutes, coffee included. That’s enough to spin it up, install everything, and feel like you’ve actually been productive.
The API response you’ll get looks something like this:
{
  "server": {
    "id": 111286454,
    "name": "malware-3",
    "status": "initializing",
    "server_type": {
      "id": 45,
      "name": "cax11",
      "architecture": "arm",
      "cores": 2,
      "cpu_type": "shared",
      "category": "cost_optimized",
      "deprecated": false,
      "deprecation": null,
      "description": "CAX11",
      "disk": 40,
      "memory": 4,

    "datacenter": {
      "id": 3,
      "description": "Helsinki 1 virtual DC 2",
      "location": {
        "id": 3,
        "name": "hel1",
        "description": "Helsinki DC Park 1",
        "city": "Helsinki",
        "country": "FI",
        "latitude": 60.169855,
        "longitude": 24.938379,
        "network_zone": "eu-central"
      },
      "name": "hel1-dc2",

    "image": {
      "id": 310557660,
      "type": "system",
      "name": "debian-13",
      "architecture": "arm",
      "bound_to": null,
      "created_from": null,
      "deprecated": null,
      "description": "Debian 13",
      "disk_size": 5,
      "image_size": null,
      "labels": {},
      "os_flavor": "debian",
      "os_version": "13",
      "protection": { "delete": false },
      "rapid_deploy": true,
      "status": "available",
      "created": "2025-08-18T06:21:01Z",
      "deleted": null
    },
    "iso": null,
    "primary_disk_size": 40,
    "labels": { "environment": "prod" },
    "protection": { "delete": false, "rebuild": false },
    "backup_window": null,
    "rescue_enabled": false,
    "locked": false,
    "placement_group": null,
    "public_net": {
      "firewalls": [],
      "floating_ips": [],
      "ipv4": {
        "id": 104700543,
        "ip": "46.62.143.86",
        "blocked": false,
        "dns_ptr": "static.86.143.62.46.clients.your-server.de"
      },
      "ipv6": null
    },
    "private_net": [],
    "load_balancers": [],
    "volumes": [],
    "included_traffic": 0,
    "ingoing_traffic": 0,
    "outgoing_traffic": 0,
    "created": "2025-10-21T18:21:57Z"
  },
  "root_password": null,
  "action": {
    "id": 587706152218663,
    "command": "create_server",
    "started": "2025-10-21T18:21:57Z",
    "finished": null,
    "progress": 0,
    "status": "running",
    "resources": [
      { "id": 111286454, "type": "server" },
      { "id": 310557660, "type": "image" }
    ],
    "error": null
  },
  "next_actions": [
    {
      "id": 587706152218664,
      "command": "start_server",
      "started": "2025-10-21T18:21:57Z",
      "finished": null,
      "progress": 0,
      "status": "running",
      "resources": [{ "id": 111286454, "type": "server" }],
      "parent_id": 587706152218663,
      "error": null
    }
  ]
}
I trimmed the response down a bit for clarity, but keep an eye on the id: 111286454. You’ll need that little guy for the next API calls.
Next up: let’s check the status of our server to make sure it’s actually alive and not just pretending. Keep the Change node and the HTTP Request node ( I am referring to the Request Node from the first screenshot of this post ) as they are. All you need is a shiny new Function node that looks like this:
msg.server_id = "111286454"

msg.method = "GET"
msg.url = msg.api_url + "servers" + "/" + msg.server_id


msg.headers = {
  "Authorization": "Bearer " + msg.api_key,
  "Content-Type": "application/json"
};

return msg;
That’ll get you (I removed some parts):
{
  "server": {
    "id": 111286454,
    "name": "malware-3",
    "status": "running",
    "server_type": {
      "id": 45,
      "name": "cax11",
      "architecture": "arm",
      "cores": 2,
      "cpu_type": "shared",
      "category": "cost_optimized",
      "deprecated": false,
      "deprecation": null,
      "description": "CAX11",
      "disk": 40,
      "memory": 4,
      "prices": [
        {
          "location": "fsn1",
          "price_hourly": {
            "gross": "0.0053000000000000",
            "net": "0.0053000000"
          },
          "price_monthly": {
            "gross": "3.2900000000000000",
            "net": "3.2900000000"
          },
          "included_traffic": 21990232555520,
          "price_per_tb_traffic": {
            "gross": "1.0000000000000000",
            "net": "1.0000000000"
          }
        },
        {
          "location": "hel1",
          "price_hourly": {
            "gross": "0.0053000000000000",
            "net": "0.0053000000"
          },
          "price_monthly": {
            "gross": "3.2900000000000000",
            "net": "3.2900000000"
          },
          "included_traffic": 21990232555520,
          "price_per_tb_traffic": {
            "gross": "1.0000000000000000",
            "net": "1.0000000000"
          }
        },
        {
          "location": "nbg1",
          "price_hourly": {
            "gross": "0.0053000000000000",
            "net": "0.0053000000"
          },
          "price_monthly": {
            "gross": "3.2900000000000000",
            "net": "3.2900000000"
          },
          "included_traffic": 21990232555520,
          "price_per_tb_traffic": {
            "gross": "1.0000000000000000",
            "net": "1.0000000000"
          }
        }
      ],
    },
    "image": {
      "id": 310557660,
      "type": "system",
      "name": "debian-13",
      "architecture": "arm",
      "bound_to": null,
      "created_from": null,
      "deprecated": null,
      "description": "Debian 13",
      "disk_size": 5,
      "image_size": null,
      "labels": {},
      "os_flavor": "debian",
      "os_version": "13",
      "protection": { "delete": false },
      "rapid_deploy": true,
      "status": "available",
      "created": "2025-08-18T06:21:01Z",
      "deleted": null
    },
    "primary_disk_size": 40,
    "labels": { "environment": "prod" },
    "public_net": {
      "firewalls": [],
      "floating_ips": [],
      "ipv4": {
        "id": 104700543,
        "ip": "46.62.143.86",
        "blocked": false,
        "dns_ptr": "static.86.143.62.46.clients.your-server.de"
      },
    },
    "included_traffic": 21990232555520,
    "ingoing_traffic": 0,
    "outgoing_traffic": 0,
    "created": "2025-10-21T18:21:57Z"
  }
}
As you can see, the server is up and running and we’ve got our shiny new public IP staring back at us. Always a good sign it’s alive and kicking.

Connection time!
We can now jump into the server with a simple SSH command:
ssh -o -i /root/.ssh/karls-private-key -p 2222 [email protected](Yes, that’s my demo IPm don’t get any ideas. 😉)
Alright, server served its purpose, so let’s shut it down before Hetzner starts charging me for its electricity bill.
For the next step: keep the Change and HTTP Request nodes as they are, and just drop in a fresh Function node like this:
msg.server_id = "111286454"
msg.method = "DELETE"
msg.url = msg.api_url + "servers" + "/" + msg.server_id

msg.headers = {
  "Authorization": "Bearer " + msg.api_key,
  "Content-Type": "application/json"
};

return msg;
Returns:
{
  "id": 587706152224982,
  "command": "delete_server",
  "started": "2025-10-21T18:32:28Z",
  "finished": null,
  "progress": 0,
  "status": "running",
  "resources": [{ "id": 111286454, "type": "server" }],
  "error": null
}
And just like that – poof! – our server is gone.
If you head over to the Hetzner Cloud dashboard, you’ll see… well, absolutely nothing. (Insert a screenshot of emptiness here 😂).
Changing the reverse DNS
If you’re planning to host something on this server, you’ll probably want to set a reverse DNS (PTR record) so your domain name points back correctly. Mail servers especially are picky about this, without it, your emails might end up in spam faster than you can say “unsubscribe.“
As usual, keep the Change and HTTP Request nodes. Here’s the Function node you’ll need:
msg.server_id = "111286454"
msg.ip = "46.62.143.86"
msg.subdomain = "subdomain.karl.fail"

msg.method = "POST"
msg.url = msg.api_url + "servers/" + msg.server_id + "/actions/change_dns_ptr"

msg.headers = {
	"Authorization": "Bearer " + msg.api_key,
	"Content-Type": "application/json"
};

msg.payload = {
	"ip": msg.ip,
	"dns_ptr": msg.subdomain
}

return msg;
Before setting reverse DNS, double-check that your subdomain already has an A-Record pointing to the server’s IP. Technically, the Hetzner command doesn’t care, but trust me, you’ll want it in place.
Cloudflare: Set A-Record
Good news: we can automate that part, too. I’ll do a separate deep dive on it, but here’s the Function node you’ll need to set an A-Record through Cloudflare:
// zone_id = The Cloudflare Zone
// bearer_token = Your Cloudflare API Token with DNS-Write permissions

msg.url = "https://api.cloudflare.com/client/v4/zones/" + msg.zone_id +"/dns_records";
msg.headers = {
    "Authorization": "Bearer " + msg.bearer_token
};
msg.payload = {
    "name": "subdomain.karl.fail",
    "ttl": 3600,
    "type": "A",
    "comment": "New worker from Node-RED",
    "content": "46.62.143.86",
    "proxied": true
};

return msg;
Nice, we’ve basically automated the whole worker lifecycle. ✅
Next step: run a long-running scan on the cloud host (I use nohup or tmux/screen), monitor it over SSH, and when it finishes scp the results back for processing. Example flow:
- start the job on the cloud host with nohup <tool> & (or in a tmux session so you can attach later).
- periodically SSH in and check the process (pgrep -a masscan / ps aux | grep masscan).
- when it’s done, scp the output back to your machine and kick off post-processing.
Why do this in the cloud? Tools like masscan will absolutely saturate your home/office bandwidth. Running them remotely avoids choking your local network and gives you the throughput you actually need, plus you can tear the instance down when you’re done (no lingering bills, no guilt).

I keep my key paths in the SSH-key node and run a quick remote check to see if masscan is still alive.
What I send: build an SSH one-liner and parse the output.
msg.cmd = "ps -aux | grep masscan"

msg.payload = "ssh -o StrictHostKeyChecking=no -o UserKnownHostsFile=/dev/null -i " + msg.ssh_path_private + " -p " + msg.port + " " + msg.username + "@" + msg.ip_addr + " " + `${msg.cmd}`
return msg;
StrictHostKeyChecking=no skips the “Are you sure you want to connect?“prompt when hitting a fresh server, and UserKnownHostsFile=/dev/null stops SSH from cluttering your known_hosts file with throwaway fingerprints.
Perfect for ephemeral workers—not so great for production, unless you enjoy living on the edge. 😅
Pro tip: write easy-to-parse commands
Instead of scraping messy output, keep things clean and structured. For example, here I check if my certspotter system service is running:
msg.cmd = "sudo systemctl is-active certspotter"Run that via SSH on the remote system, then parse the response like so:
let tmp = msg.payload

msg.payload = {
    status: tmp.trim(),
    is_active: tmp.trim().toLowerCase() === "active",
    command: msg.cmd,
    remote_ip: msg.ip
};

return msg;
Now I’ve got a neat, machine-friendly healthcheck result I can reuse anywhere. No more grepping random strings or wondering if “running” really means running.
Bonus: Keep your workers warm
Sometimes you don’t want to constantly create and delete servers. Maybe you just want to pause a worker and spin it back up later without paying for full runtime.
That’s where two extra Function nodes come in handy: one for shutdown, one for power on.
👉 This way, you can park your worker, save on running costs, and still keep the storage around for when you need it again. (Storage will still cost a little, but it’s way cheaper than leaving the CPU humming all day.)
Shutdown
msg.server_id = "111286454"

msg.method = "POST"
msg.url = msg.api_url + "servers" + "/" + msg.server_id + "/actions/shutdown"

msg.headers = {
	"Authorization": "Bearer " + msg.api_key,
	"Content-Type": "application/json"
};

return msg;
Power On
msg.server_id = "111286454"

msg.method = "POST"
msg.url = msg.api_url + "servers" + "/" + msg.server_id + "/actions/poweron"

msg.headers = {
	"Authorization": "Bearer " + msg.api_key,
	"Content-Type": "application/json"
};

return msg;
Summary
So, what did we cover? We learned how to use Node-RED to talk to the Hetzner Cloud API, spin up workers, run tasks, and clean them up again, without breaking a sweat (or the bank).
I also poked at the Firewall API endpoints in my dev environment, I didn’t include them here. They work just as smoothly, but honestly, I rarely bother with Hetzner firewalls since my workers are short-lived and get nuked when the job’s done. For anything long-running though, I’d definitely recommend offloading some of that work, otherwise a simple ufw setup does the trick for me.
If you liked this, you might also enjoy my other post: Building Nmap-as-a-Service with Node-RED.
My setup for most od these tools is usually Node-Red inside a Kali LXC, chaining it into pipelines like Discord bots or APIs.
Because let’s be honest: if you can turn hacking tools into Lego blocks, why wouldn’t you? 😅