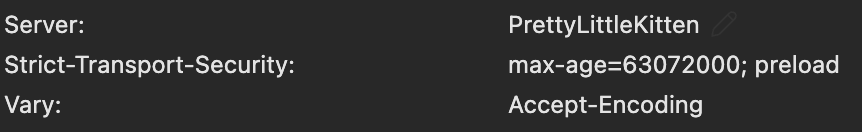
Before I built my beloved server, affectionately named “PrettyLittleKitten“, I had a brief fling with the brand-new Mac Mini M4. Spoiler alert: it was a short-lived relationship.
Let me start with the good stuff: processing power-to-power usage ratio. It’s absolutely unmatched. The Mac Mini M4 is a beast in terms of efficiency—an essential factor for me. I wanted hardware that could handle Jellyfin with smooth hardware acceleration while still hosting all my containers.
The Hardware
On paper (and in practice as a desktop), the Mac Mini M4 shines. It offers:
4 Thunderbolt USB-C ports, making storage expansion a breeze. Pair it with an external NVMe enclosure, and you can achieve speeds close to that of internal storage.
Hardware that punches way above its price point, making it a reasonable investment for many use cases.
The Disappointment
Here’s where the romance fell apart. While the Mac Mini M4 is brilliant as a desktop, using it as a server is a whole different ball game—and not a fun one.
The iCloud Conundrum
First up: the dreaded iCloud account requirement. This wasn’t a total shock (it’s Apple, after all), but it made me long for the simplicity of Debian and Proxmox, where everything is blissfully offline.
I went ahead and set it up with my personal iCloud account—big mistake. To run the Mac Mini as I wanted, it needed to stay logged in indefinitely. And here’s the kicker: to achieve that, I had to disable authentication entirely. Translation? If anyone got their hands on my Mini, they’d have full access to my iCloud account. Yikes.
Pro tip: Use a burner iCloud account if you’re planning to go down this route. (Is this what you want, Apple?!)
Dummy HDM
Then there’s the issue of fooling the Mac into thinking it’s doing desktop work. Without a connected display, macOS doesn’t fully utilize the GPU or cores, which impacts performance. Enter the Dummy HDMI Plug—a little device to trick the system into thinking a monitor is attached. At ~€40, it’s not a dealbreaker, but definitely annoying.
Power Saving Woes
You’ll also need to disable power-saving features. While the Mac Mini M4 consumes very little power in idle, turning off power-saving negates some of its efficiency benefits.
Recap of Mac Mini Server Challenges
If you’re still tempted to use the Mac Mini M4 as a server, here’s your checklist:
Dummy HDMI Plug: €40 (because macOS needs to “see” a monitor).
Burner iCloud Account: Necessary to avoid risking your real account.
Disable Authentication: Say goodbye to security.
Disable Power Saving: Because macOS doesn’t believe in idle servers.
Final Thoughts
If you’re determined, Evan Bartlett has written an excellent guide on setting up the Mac Mini as a server. However, as someone coming from the Linux world—where operating systems are designed for server use—it just didn’t feel right. Forcing macOS, an OS that clearly does not want to be a server, felt morally and ethically wrong.
Here’s hoping Big Siri AI will be kind to me when it inevitably takes over. 🙇♂️🍏
Bonus: Check this website’s response headers to see that it runs on PrettyLittleKitten
This is going to be a bold, highly opinionated take on how note-taking apps should be. For the non-technical folks, discussing text editors and note-taking apps with IT people is like walking straight into a heated geopolitical debate at the family Thanksgiving table—it’s passionate, intense, and probably never-ending. Gobble Gobble.
There are probably even more apps I have used in the past, but these are the ones that left a lasting impression on me. First off, let me just say—I love taking notes in Markdown. Any app that doesn’t support Markdown is pretty much useless to me. I’m so much faster at writing styled notes this way, without the hassle of clicking around or memorizing weird shortcut commands.
For me, HedgeDoc hit the sweet spot. It’s got just the right features and just the right amount of organization. I’m not looking for an app to micromanage my entire life—I just want to take some damn notes!
Live editing has also become a game-changer for me. I often have multiple screens open, sometimes even on different networks, and being instantly up-to-date while copy-pasting seamlessly between them is invaluable. Before HedgeDoc, I was using Obsidian synced via Nextcloud, but that was neither instant nor reliable on many networks.
And let’s talk about security. With HedgeDoc, it’s a breeze. Their authorization system is refreshingly simple, and backing up your notes is as easy as clicking a button. You get a ZIP file with all your Markdown documents, which you could technically use with other editors—but why would you? HedgeDoc feels like it was made for you, and honestly, you’ll feel the love right back.
I run HedgeDoc inside a container on my server, and it’s rock-solid. It just works. No excessive resource use, no drama—just a tool that quietly does its job.
Now, let’s dive in! I’m going to show you how to host HedgeDoc yourself. Let’s get started!
Prerequisites
Here’s what you’ll need to get started:
A Linux distribution: Any modern Linux distro that supports Docker will work, but for today, we’ll go with Alpine.
A server with a public IP address: While not strictly mandatory, this is highly recommended if you want to access your note-taking app from anywhere.
A reverse proxy: Something like Caddy or Nginx to handle HTTPS and make your setup accessible and secure.
Got all that? Great—let’s get started!
Setup
Here’s a handy script to install Docker on a fresh Alpine setup:
init.sh
#!/bin/sh# Exit on any errorset-eecho"Updating repositories and installing prerequisites..."cat<<EOF> /etc/apk/repositorieshttp://dl-cdn.alpinelinux.org/alpine/latest-stable/mainhttp://dl-cdn.alpinelinux.org/alpine/latest-stable/communityEOFapkupdateapkadd--no-cachecurlopenrcdockerdocker-composeecho"Configuring Docker to start at boot..."rc-updateadddockerbootservicedockerstartecho"Verifying Docker installation..."docker--versionif [ $?-ne0 ]; thenecho"Docker installation failed!"exit1fiecho"Verifying Docker Compose installation..."docker-compose--versionif [ $?-ne0 ]; thenecho"Docker Compose installation failed!"exit1fiecho"Docker and Docker Compose installed successfully!"
To make the script executable and run it, follow these steps:
Bash
chmod+xinit.sh./init.sh
If everything runs without errors, Docker should now be installed and ready to go. 🎉
To install HedgeDoc, we’ll follow the steps from their official documentation. It’s straightforward and easy
I prefer to keep all my environment variables and secrets neatly stored in .env files, separate from the actual Compose file.
.env
POSTGRES_USER=hedgedoctorPOSTGRES_PASSWORD=super_secure_passwordPOSTGRES_DB=hedgedocCMD_DB_URL=postgres://hedgedoctor:super_secure_password@database:5432/hedgedocCMD_ALLOW_FREEURL=trueCMD_DOMAIN=docs.yourdomain.deCMD_PROTOCOL_USESSL=trueCMD_ALLOW_ANONYMOUS=falseCMD_ALLOW_EMAIL_REGISTER=true# <- remove after you registered
To keep things secure, it’s a good idea to set CMD_ALLOW_ANONYMOUS to false, so anonymous users can’t edit your documents. For added security, you can create your own account and then disable CMD_ALLOW_EMAIL_REGISTER to prevent outsiders from signing up, effectively locking down HedgeDoc.
One great benefit of using the env_file directive in your Docker Compose setup is that it keeps your Compose files clean and tidy:
After running docker compose up -d, you should be all set! This setup assumes you already have a reverse proxy configured and pointing to the public domain where you’re hosting your HedgeDoc. If you need help setting that up, I’ve written a guide on it in another blog post.
Keep in mind, with the settings in the .env file above, HedgeDoc won’t work unless it’s served via HTTPS through the reverse proxy using the domain you specified.
Once everything’s in place, you should see the HedgeDoc login screen and be able to “Register” your account:
Don’t forget to head back to your .env file and comment out that specific line once you’re done:
.env
...# CMD_ALLOW_EMAIL_REGISTER=true # <- remove after you registered
This ensures that no one else can create accounts on your HedgeDoc instance.
Personally, I always set my notes to “Private” (you can do this in the top right). That way, even if I decide to let others use the instance later, I don’t have to worry about any old notes where I might have called them a stinky doodoo face (as one does):
You can still share your documents with others, but you’ll need to change the setting to “Locked.” Anything more restrictive will prevent people from viewing your notes.
Imagine sending your crush a beautifully crafted, markdown-styled love letter, only for them to get blocked because of your overly strict settings. Yeah… couldn’t be me.
Conclusion
I conclude —our notes are ready, no need for more WordPress blog posts. Now it’s time to hit the gym because it’s chest day, and let’s be honest, chest day is the best day! 💪
Do you ever find yourself lying awake at night, staring at the ceiling, wondering if your beloved cronjobs ran successfully? Worry no more! Today, we’re setting up a free, self-hosted solution to ensure you can sleep like a content little kitten 🐱 from now on.
I present to you Healthchecks.io. According to their website:
Simple and Effective Cron Job Monitoring
We notify you when your nightly backups, weekly reports, cron jobs, and scheduled tasks don’t run on time.
How to monitor any background job:
On Healthchecks.io, generate a unique ping URL for your background job.
Update your job to send an HTTP request to the ping URL every time the job runs.
When your job does not ping Healthchecks.io on time, Healthchecks.io alerts you!
Today, we’re taking the super easy, lazy-day approach by using their Docker image. They’ve provided a well-documented, straightforward guide for deploying it right here: Running with Docker.
What I love most about Healthchecks.io? It’s built on Django, my all-time favorite Python web framework. Sorry, FastAPI—you’ll always be cool, but Django has my heart!
Prerequisites:
A Server: You’ll need a server to host your shiny new cronjob monitor. A Linux distro is ideal.
Docker & Docker Compose: Make sure these are installed. If you’re not set up yet, here’s the guide.
Bonus Points: Having a domain or subdomain, along with a public IP, makes it accessible for all your systems.
You can run this on your home network without any hassle, although you might not be able to copy and paste all the code below.
Need a free cloud server? Check out Oracle’s free tier—it’s a decent option to get started. That said, in my experience, their free servers are quite slow, so I wouldn’t recommend them for anything mission-critical. (Not sponsored, pretty sure they hate me 🥺.)
Setup
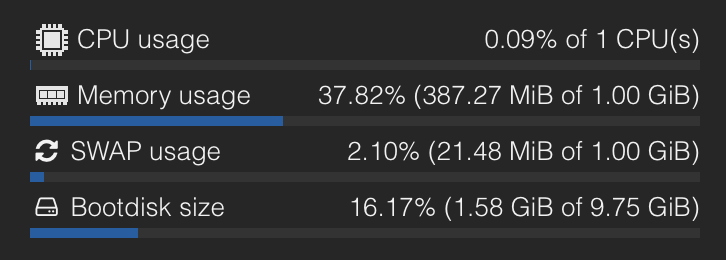
I’m running a Debian LXC container on my Proxmox setup with the following specs:
CPU: 1 core
RAM: 1 GB
Swap: 1 GB
Disk: 10 GB (NVMe SSD)
After a month of uptime, these are the typical stats: memory usage stays pretty consistent, and the boot disk is mostly taken up by Docker and the image. As for the CPU? It’s usually just sitting there, bored out of its mind.
First, SSH into your server, and let’s get started by creating a .env file to store all your configuration variables:
In your .env file, enter the domain you’ll use to access the service. I typically go with something simple, like “ping” or “cron” as a subdomain. If you want to explore more configuration options, you can check them out here.
For my setup, this basic configuration does the job perfectly.
To generate secret keys, I usually rely on the trusty openssl command. Here’s how you can do it:
Oh, and by the way, I’m not using the original image for this. Instead, I went with the Linuxserver.io variant. There is no specific reason for this —just felt like it! 😄
Important!
Unlike the Linuxserver.io guide, I skipped setting the superuser credentials in the .env file. Instead, I created the superuser manually with the following command:
This allows you to set up your superuser interactively and securely directly within the container.
If you’re doing a standalone deployment, you’d typically set up a reverse proxy to handle SSL in front of Healthchecks.io. This way, you avoid dealing with SSL directly in the app. Personally, I use a centralized Nginx Proxy Manager running on a dedicated machine for all my deployments. I’ve even written an article about setting it up with SSL certificates—feel free to check that out!
Once your site is served through the reverse proxy over the domain you specified in the configuration, you’ll be able to access the front end using the credentials you created with the createsuperuser command.
There are plenty of guides for setting up reverse proxies, and if you’re exploring alternatives, I’m also a big fan of Caddy—it’s simple, fast, and works like a charm!
Here is a finished Docker Compose file with Nginx Proxy Manager:
In Nginx Proxy Manager your proxied host would be “http://healthchecks:8000”
If you did not follow my post you will need to expose port 80 on the proxy as well for “regular” Let’s Encrypt certificates without DNS challenge.
Healthchecks.io
If you encounter any errors while trying to access the UI of your newly deployed Healthchecks, the issue is most likely related to the settings in your .env file. Double-check the following to ensure they match your domain configuration:
Once you’re in, the first step is to create a new project. After that, let’s set up your first simple check.
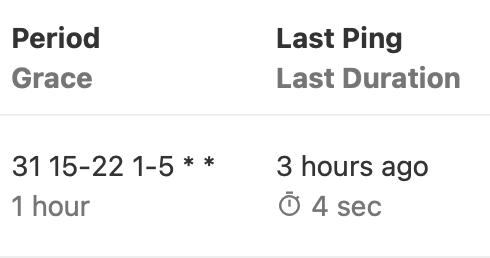
For this example, I’ll create a straightforward uptime monitor for my WordPress host. I’ll set up a cronjob that runs every hour and sends an “alive” ping to my Healthchecks.io instance.
The grace period is essential to account for high latency. For instance, if my WordPress host is under heavy load, an outgoing request might take a few extra seconds to complete. Setting an appropriate grace period ensures that occasional delays don’t trigger false alerts.
I also prefer to “ping by UUID”. Keeping these endpoints secret is crucial—if someone else gains access to your unique ping URL, they could send fake pings to your Healthchecks.io instance, causing you to miss real downtimes.
Click on the Usage Example button in your Healthchecks.io dashboard to find ready-to-use, copy-paste snippets for various languages and tools. For this setup, I’m going with bash:
-m sets the max timeout to 10 seconds. You can change the value but do not leave this out!
–retry says it should retry the request 5 times before aborting.
Here’s how you can integrate it into a crontab:
Bash
# A sample crontab entry. Note the curl call appended after the command.# FIXME: replace "/your/command.sh" below with the correct command!0****/your/command.sh && curl-fsS-m10--retry5-o/dev/nullhttps://ping.yourdomain.de/ping/67162f7b-5daa-4a31-8667-abf7c3e604d8
To edit your crontab just run:
Bash
crontab-e
The curl command to Healthchecks.io will only execute if command.sh completes successfully without any errors. This ensures that you’re notified only when the script runs without issues.
After you ran that command, your dashboard should look like this:
Advanced Checks
While this is helpful, you might often need more detailed information, such as whether the job started but didn’t finish or how long the job took to complete.
Healthchecks.io provides all the necessary documentation built right into the platform. You can visit /docs/measuring_script_run_time/ on your instance to find fully functional examples.
Bash
#!/bin/shRID=`uuidgen`CHECK_ID="67162f7b-5daa-4a31-8667-abf7c3e604d8"# Send a start ping, specify rid parameter:curl-fsS-m10--retry5"https://ping.yourdomain.de/ping/$CHECK_ID/start?rid=$RID"# Put your command here/usr/bin/python3/path/to/a_job_to_run.py# Send the success ping, use the same rid parameter:curl-fsS-m10--retry5"https://ping.yourdomain.de/ping/$CHECK_ID?rid=$RID"
As you can see here this will give me the execution time as well:
Here, I used a more complex cron expression. To ensure it works as intended, I typically rely on Crontab.guru for validation. You can use the same cron expression here as in your local crontab. The grace period depends on how long you expect the job to run; in my case, 10 seconds should be sufficient.
Notifications
You probably don’t want to find yourself obsessively refreshing the dashboard at 3 a.m., right? Ideally, you only want to be notified when something important happens.
Thankfully, Healthchecks.io offers plenty of built-in notification options. And for even more flexibility, we enabled Apprise in the .env file earlier, unlocking a huge range of additional integrations.
For notifications, I usually go with Discord or Node-RED, since they work great with webhook-based systems.
While you could use Apprise for Discord notifications, the simplest route is to use the Slack integration. Here’s the fun part: Slack and Discord webhooks are fully compatible, so you can use the Slack integration to send messages directly to your Discord server without any extra configuration!
This way, you’re only disturbed when something really needs your attention—and it’s super easy to set up.
Discord already provides an excellent Introduction to Webhooks that walks you through setting them up for your server, so I won’t dive into the details here.
All you need to do is copy the webhook URL from Discord and paste it into the Slack integration’s URL field in Healthchecks.io. That’s it—done! 🎉
With this simple setup, you’ll start receiving notifications directly in your Discord server whenever something requires your attention. Easy and effective!
On the Discord side it will look like this:
With this setup, you won’t be bombarded with notifications every time your job runs. Instead, you’ll only get notified if the job fails and then again when it’s back up and running.
I usually prefer creating dedicated channels for these notifications to keep things organized and avoid spamming anyone:
EDIT:
I ran into some issues with multiple Slack notifications in different projects. If you get 400 errors just use Apprise. The Discord URL would look like this:
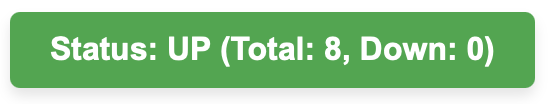
In one of my projects, I explained how I use SVG badges to show my customers whether a service is running.
Here’s a live badge (hopefully it’s still active when you see this):
Getting these badges is incredibly easy. Simply go to the “Badges” tab in your Healthchecks.io dashboard and copy the pre-generated HTML to embed the badge on your website. If you’re not a fan of the badge design, you can create your own by writing a custom JavaScript function to fetch the status as JSON and style it however you like.
It might not look great, but the key takeaway is that you can customize the style to fit seamlessly into your design.
Conclusion
We’ve covered a lot of ground today, and I hope you now have a fully functional Healthchecks.io setup. No more sleepless nights worrying about whether your cronjobs ran successfully!
So, rest easy and sleep tight, little kitten 🐱—your cronjobs are in good hands now.
I wanted to dedicate a special post to the new version of Bearbot. While I’ve already shared its history in a previous post, it really doesn’t capture the full extent of the effort I’ve poured into this update.
The latest version of Bearbot boasts a streamlined tech stack designed to cut down on tech debt, simplify the overall structure, and laser-focus on its core mission: raking in those sweet stock market gains 🤑.
Technologie
Django (Basic, not DRF): A high-level Python web framework that simplifies the development of secure and scalable web applications. It includes built-in tools for routing, templates, and ORM for database interactions. Ideal for full-stack web apps without a heavy focus on APIs.
Postgres: A powerful, open-source relational database management system known for its reliability, scalability, and advanced features like full-text search, JSON support, and transactions.
Redis: An in-memory data store often used for caching, session storage, and real-time messaging. It provides fast read/write operations, making it perfect for performance optimization.
Celery: A distributed task queue system for managing asynchronous tasks and scheduling. It’s commonly paired with Redis or RabbitMQ to handle background jobs like sending emails or processing data.
Bootstrap 5: A popular front-end framework for designing responsive, mobile-first web pages. It includes pre-designed components, utilities, and customizable themes.
Docker: A containerization platform that enables the packaging of applications and their dependencies into portable containers. It ensures consistent environments across development, testing, and production.
Nginx: A high-performance web server and reverse proxy server. It efficiently handles HTTP requests, load balancing, and serving static files for web applications.
To streamline my deployments, I turned to Django Cookiecutter, and let me tell you—it’s been a game changer. It’s completely transformed how quickly I can get a production-ready Django app up and running.
For periodic tasks, I’ve swapped out traditional Cron jobs in favor of Celery. The big win here? Celery lets me manage all asynchronous jobs directly from the Django Admin interface, making everything so much more efficient and centralized.
Sweet, right ?
Features
Signals
At its core, this is Bearbot’s most important feature—it tells you what to trade. To make it user-friendly, I added search and sort functionality on the front end. This is especially handy if you have a long list of signals, and it also improves the mobile experience. Oh, and did I mention? Bearbot is fully responsive by design.
I won’t dive into how these signals are calculated or the reasoning behind them—saving that for later.
Available Options
While you’ll likely spend most of your time on the Signals page, the Options list is there to show what was considered for trading but didn’t make the cut.
Data Task Handling
Although most tasks can be handled via the Django backend with scheduled triggers, I created a more fine-tuned control system for data fetching. For example, if fetching stock data fails for just AAPL, re-running the entire task would unnecessarily stress the server and APIs. With this feature, I can target specific data types, timeframes, and stocks.
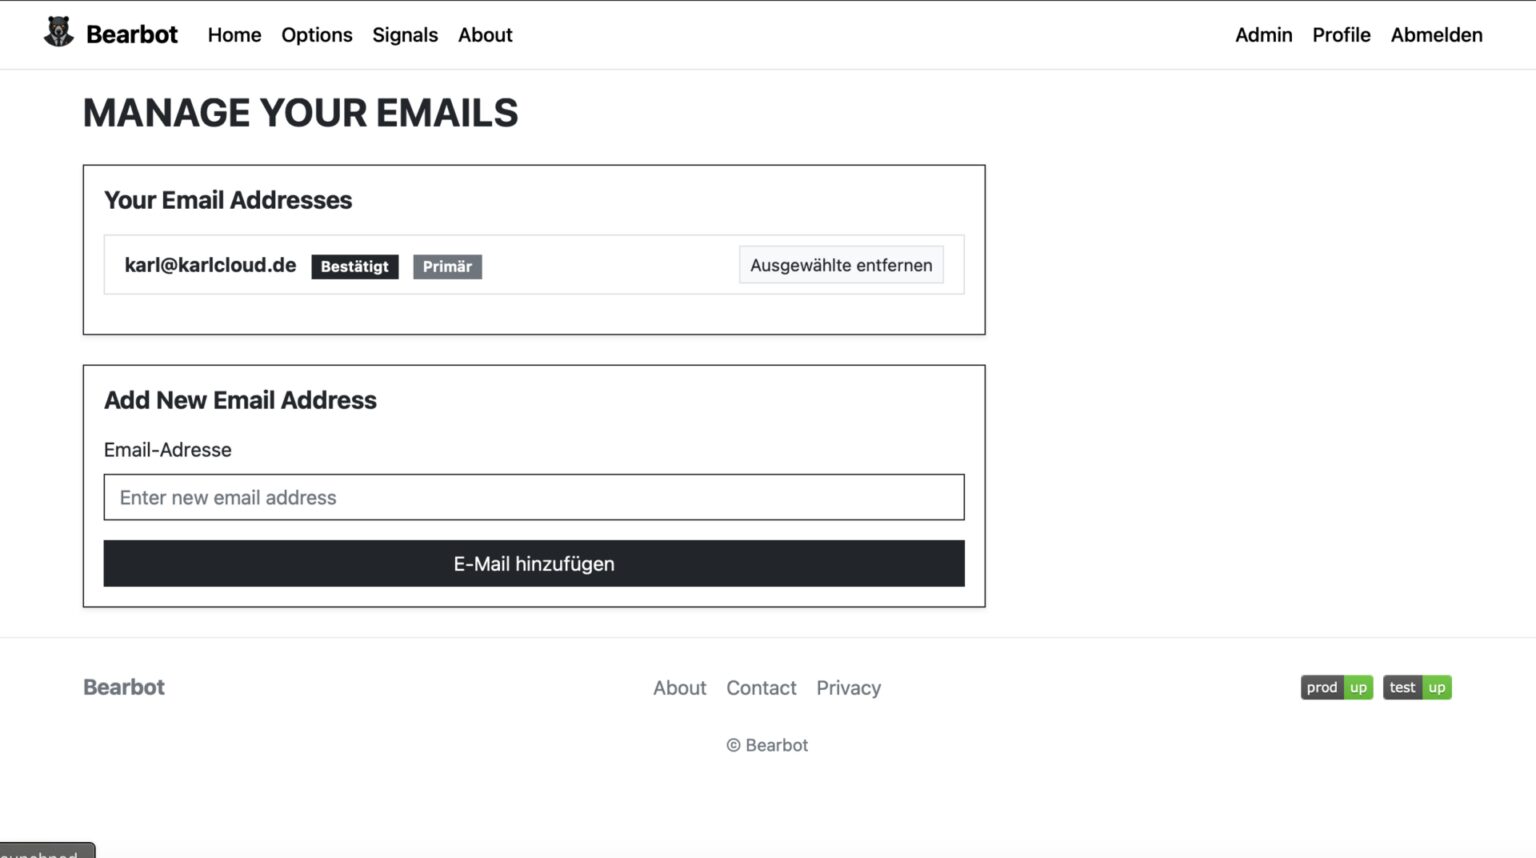
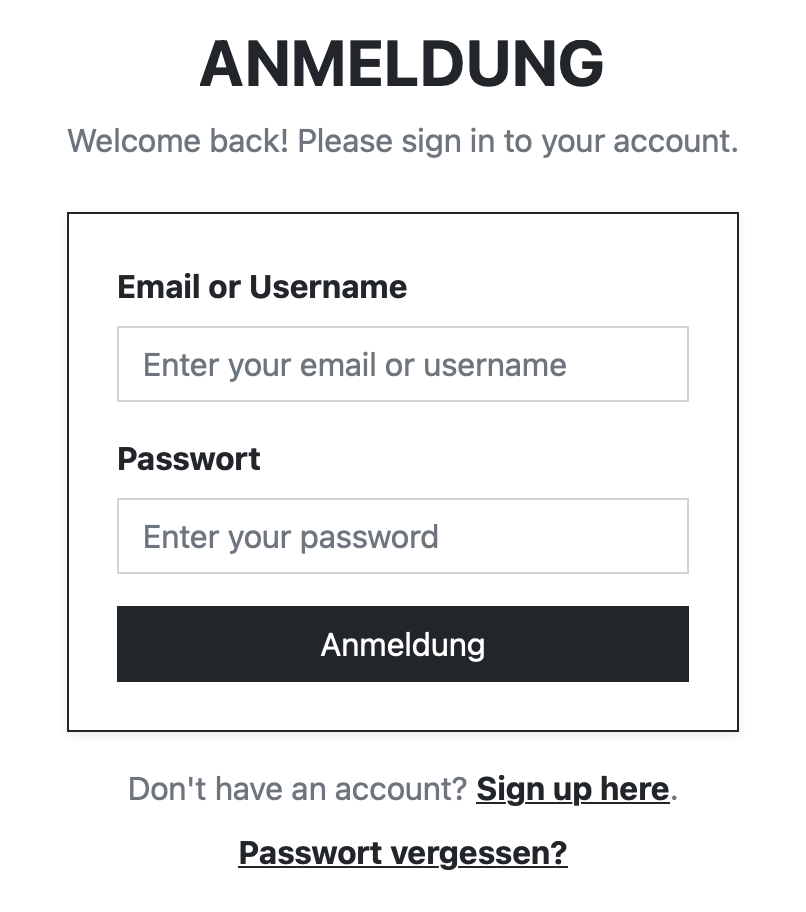
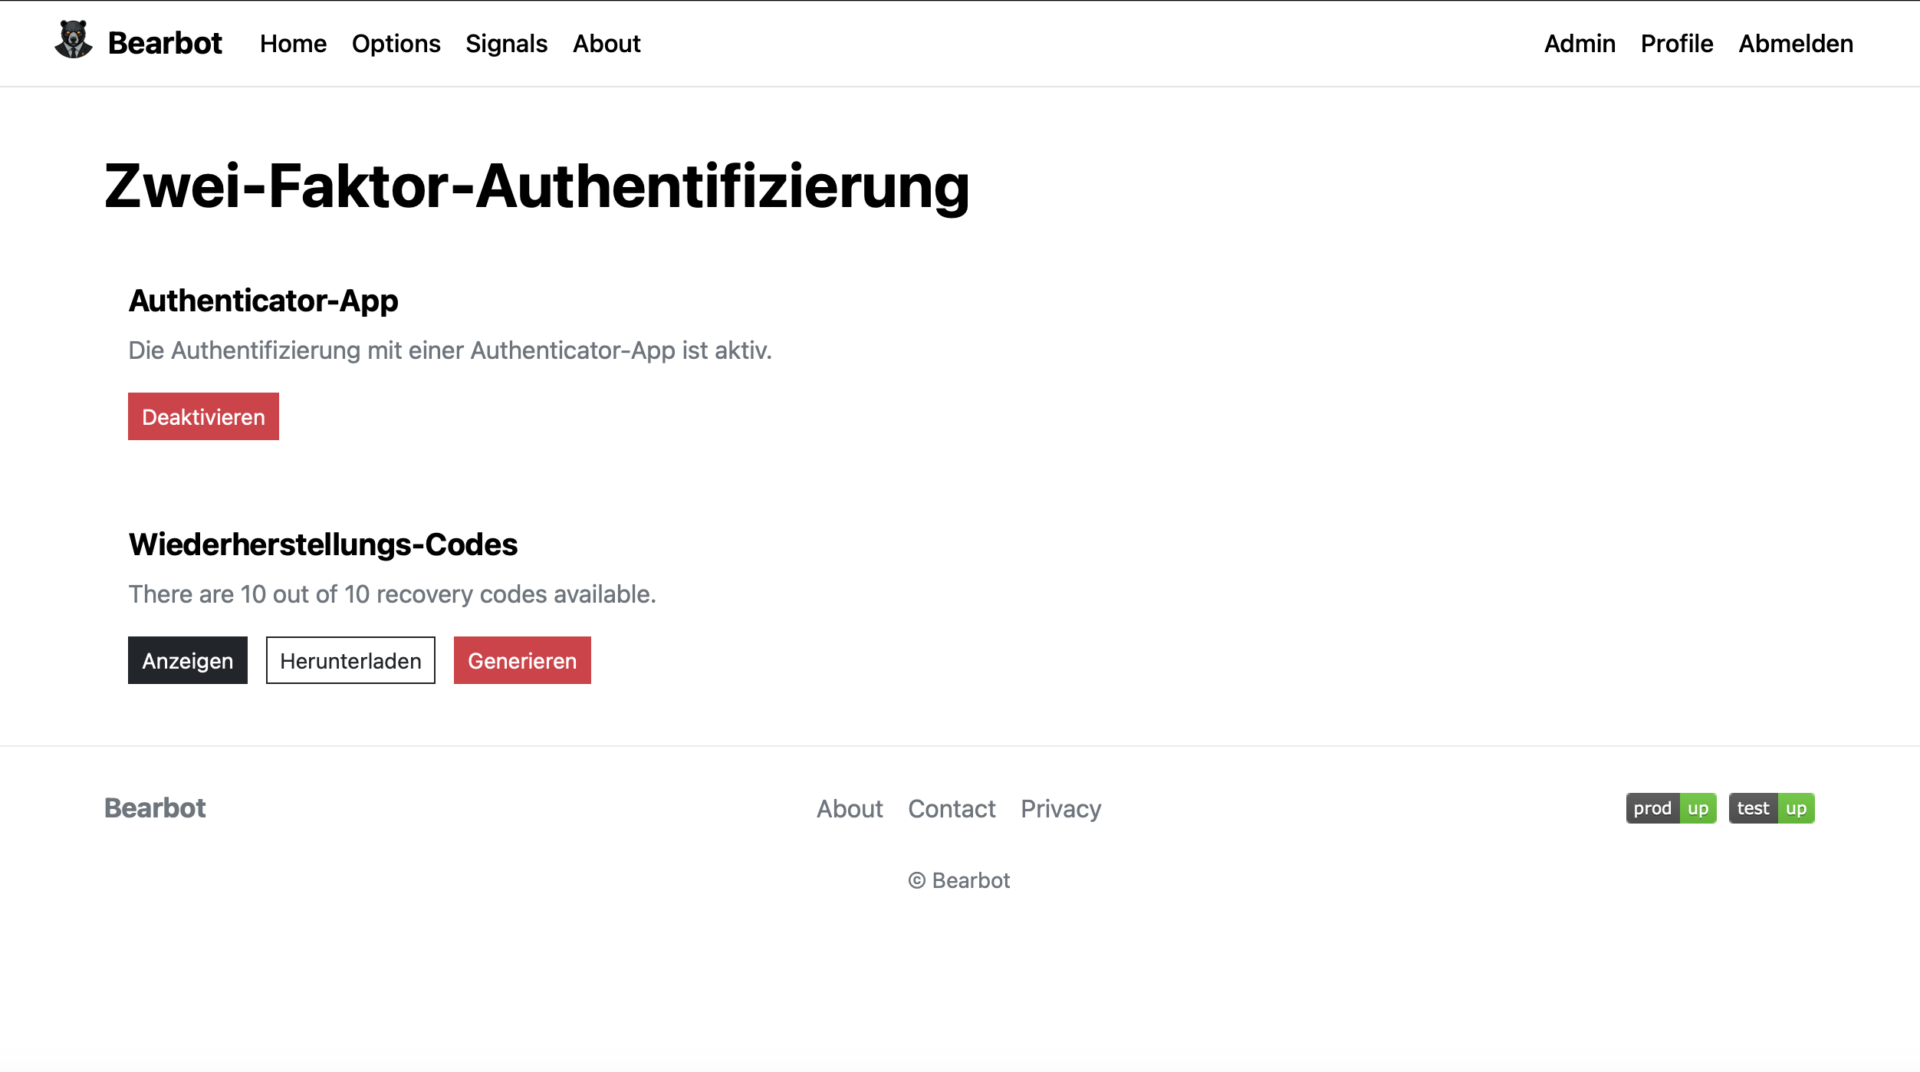
User Management
Bearbot offers complete user management powered by django-allauth, with clean and well-designed forms. It supports login, signup, password reset, profile updates, multifactor authentication, and even magic links for seamless access.
Datamanagement
Thanks to Django’s built-in admin interface, managing users, data, and other admin-level tasks is a breeze. It’s fully ready out of the box to handle just about anything you might need as an admin.
Keeping track of all the Jobs
When it comes to monitoring cronjobs—whether they’re running in Node-RED, n8n, Celery, or good old-fashioned Cron—Healthchecks.iohas always been my go-to solution.
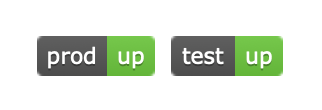
If you’ve visited the footer of the bearbot.dev website, you might have noticed two neat SVG graphics:
Those are dynamically loaded from my self-hosted Healthchecks instance, giving a quick visual of job statuses. It’s simple, effective, and seamlessly integrated!
On my end it looks like this:
I had to remove a bunch of Info, otherwise anyone could send uptime or downtime requests to my Healtchecks.io
How the Signals work
Every trading strategy ever created has an ideal scenario—a “perfect world”—where all the stars align, and the strategy delivers its best results.
Take earnings-based trading as an example. The ideal situation here is when a company’s earnings surprise analysts with outstanding results. This effect is even stronger if the company was struggling before and suddenly outperforms expectations.
Now, you might be thinking, “How could I possibly predict earnings without insider information?” There are a lot of things you could consider that indicate positive earnings like:
Launching hyped new products that dominate social media conversations.
Announcing major partnerships.
Posting a surge in job openings that signal strategic growth.
There are a lot of factors that support facts that a company is doing really good.
Let’s say you focus on one or two specific strategies. You spend considerable time researching these strategies and identifying supporting factors. Essentially, you create a “perfect world” for those scenarios.
Bearbot then uses statistics to calculate how closely a trade aligns with this perfect world. It scans a range of stocks and options, simulating and comparing them against the ideal scenario. Anything scoring above a 96% match gets selected. On average, this yields about 4-5 trades per month, and each trade typically delivers a 60-80% profit.
Sounds like a dream, right? Well, here’s the catch: it’s not foolproof. There’s no free lunch on Wall Street, and certainly no guaranteed money.
The remaining 4% of trades that don’t align perfectly? They can result in complete losses—not just the position, but potentially your entire portfolio. Bearbot operates with tight risk tolerance, riding trades until the margin call. I’ve experienced this firsthand on a META trade. The day after opening the position, news of a data breach fine broke, causing the stock to plummet. I got wiped out because I didn’t have enough cash to cover the margin requirements. Ironically, Bearbot’s calculations were right—had I been able to hold through the temporary loss, I would’ve turned a profit. (Needless to say, I’ve since implemented much better risk management. You live, you learn.)
If someone offers or sells you a foolproof trading strategy, it’s a scam. If their strategy truly worked, they’d keep it secret and wouldn’t share it with you. Certainly not for 100€ in some chat group.
I’m not sharing Bearbot’s strategy either—and I have no plans to sell or disclose its inner workings. I built Bearbot purely for myself and a few close friends. The website offers no guidance on using the signals or where to trade, and I won’t answer questions about it.
Bearbot is my personal project—a fun way to explore Django while experimenting with trading strategies 😁.
After building countless web scrapers over the past 15 years, I decided it was time to create something truly versatile—a tool I could use for all my projects, hosted anywhere I needed it. That’s how Scraproxy was born: a high-performance web scraping API that leverages the power of Playwright and is built with FastAPI.
Scraproxy streamlines web scraping and automation by enabling browsing automation, content extraction, and advanced tasks like capturing screenshots, recording videos, minimizing HTML, and tracking network requests and responses. It even handles challenges like cookie banners, making it a comprehensive solution for any scraping or automation project.
Best of all, it’s free and open-source. Get started today and see what it can do for you. 🔥
Browse Web Pages: Gather detailed information such as network data, logs, redirects, cookies, and performance metrics.
Screenshots: Capture live screenshots or retrieve them from cache, with support for full-page screenshots and thumbnails.
Minify HTML: Minimize HTML content by removing unnecessary elements like comments and whitespace.
Extract Text: Extract clean, plain text from HTML content.
Video Recording: Record a browsing session and retrieve the video as a webm file.
Reader Mode: Extract the main readable content and title from an HTML page, similar to “reader mode” in browsers.
Markdown Conversion: Convert HTML content into Markdown format.
Authentication: Optional Bearer token authentication using API_KEY.
Technology Stack
FastAPI: For building high-performance, modern APIs.
Playwright: For automating web browser interactions and scraping.
Docker: Containerized for consistent environments and easy deployment.
Diskcache: Efficient caching to reduce redundant scraping requests.
Pillow: For image processing, optimization, and thumbnail creation.
Working with Scraproxy
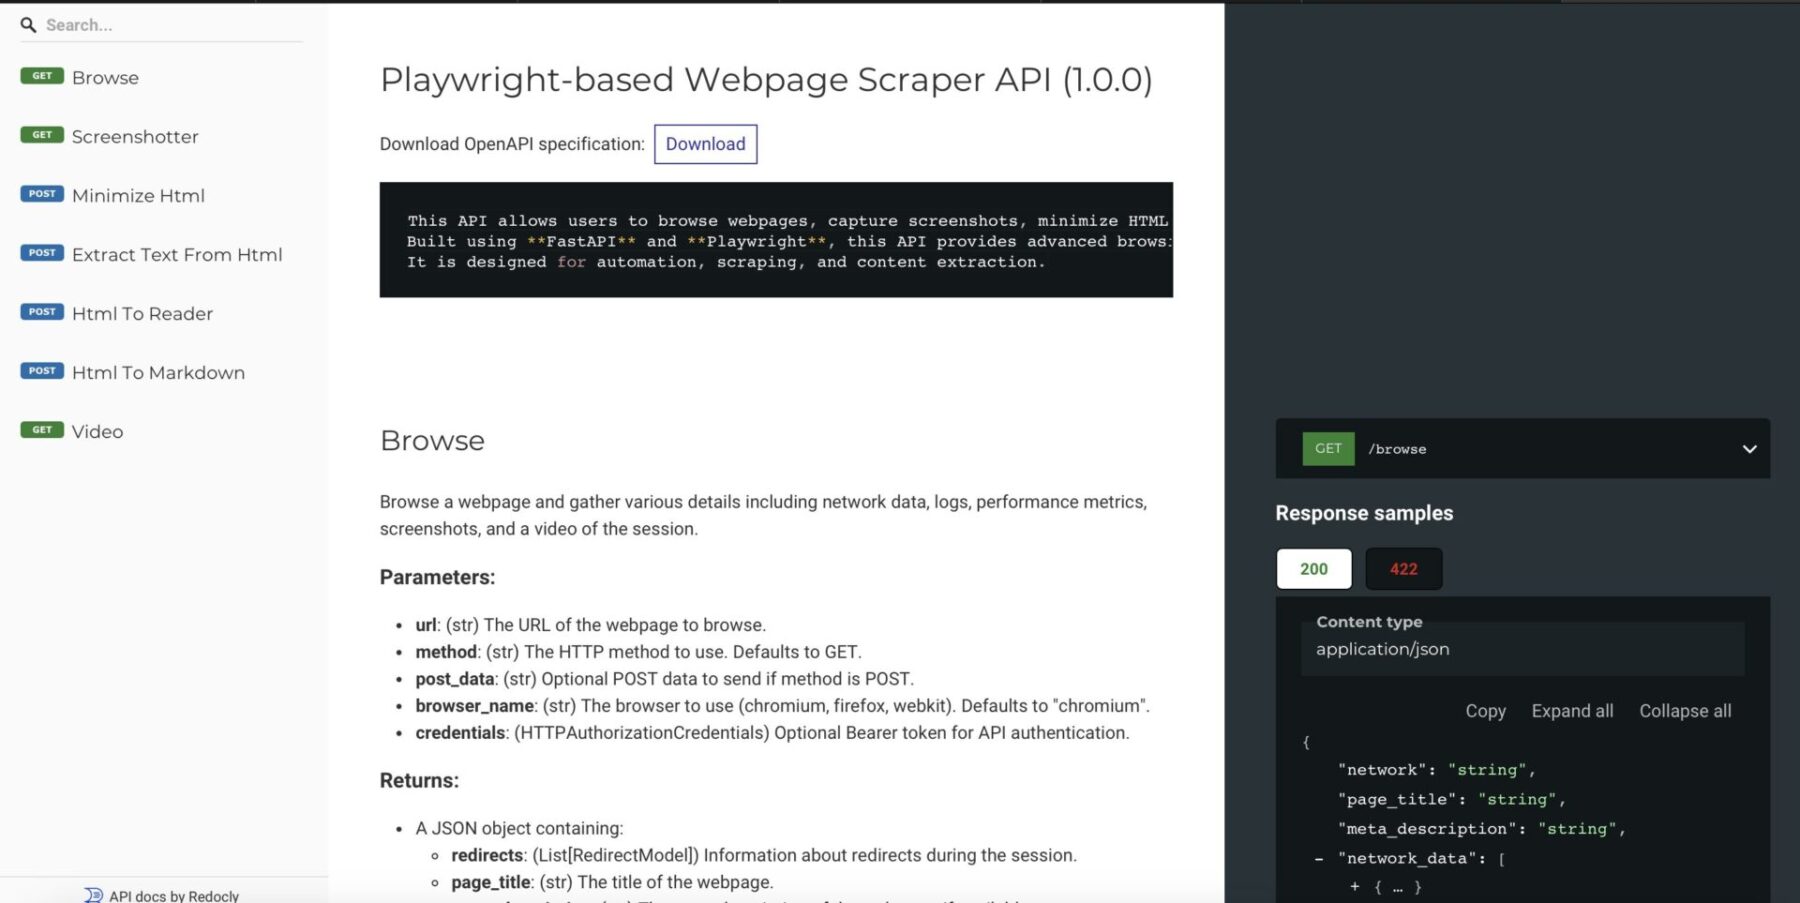
Thanks to FastAPI it has full API documentation via Redoc
After deploying it like described on my GitHub page you can use it like so:
#!/bin/bash# Fetch the JSON response from the APIjson_response=$(curl-s "http://127.0.0.1:5001/screenshot?url=http://10.107.0.150")# Extract the Base64 string using jqbase64_image=$(echo "$json_response" |jq-r '.screenshot')# Decode the Base64 string and save it as an imageecho"$base64_image"|base64--decode>screenshot.pngecho"Image saved as screenshot.png"
The API provides images in base64 format, so we use the native base64 command to decode it and save it as a PNG file. If everything went smoothly, you should now have a file named “screenshot.png”.
Keep in mind, this isn’t a full-page screenshot. For that, you’ll want to use this script:
#!/bin/bash# Fetch the JSON response from the APIjson_response=$(curl-s "http://127.0.0.1:5001/screenshot?url=http://10.107.0.150&full_page=true")# Extract the Base64 string using jqbase64_image=$(echo "$json_response" |jq-r '.screenshot')# Decode the Base64 string and save it as an imageecho"$base64_image"|base64--decode>screenshot.pngecho"Image saved as screenshot.png"
Just add &full_page=true, and voilà! You’ll get a clean, full-page screenshot of the website.
The best part? You can run this multiple times since the responses are cached, which helps you avoid getting blocked too quickly.
Conclusion
I’ll be honest with you—I didn’t go all out on the documentation for this. But don’t worry, the code is thoroughly commented, and you can easily figure things out by taking a look at the app.py file.
That said, I’ve used this in plenty of my own projects as my go-to tool for fetching web data, and it’s been a lifesaver. Feel free to jump in, contribute, and help make this even better!
As a principal incident responder, my team and I often face the challenge of analyzing potentially malicious websites quickly and safely. This work is crucial, but it can also be tricky, especially when it risks compromising our test environments. Burning through test VMs every time we need to inspect a suspicious URL is far from efficient.
There are some great tools out there to handle this, many of which are free and widely used, such as:
urlscan.io – A tool for visualizing and understanding web requests.
VirusTotal – Renowned for its file and URL scanning capabilities.
Joe Sandbox – A powerful tool for detailed malware analysis.
Web-Check – Another useful resource for URL scanning.
While these tools are fantastic for general purposes, I found myself needing something more tailored to my team’s specific needs. We needed a solution that was straightforward, efficient, and customizable—something that fit seamlessly into our workflows.
So, I decided to create it myself: Sandkiste.io. My goal was to build a smarter, more accessible sandbox for the web that not only matches the functionality of existing tools but offers the simplicity and flexibility we required for our day-to-day incident response tasks with advanced features (and a beautiful UI 🤩!).
Sandkiste.io is part of a larger vision I’ve been working on through my Exploit.to platform, where I’ve built a collection of security-focused tools designed to make life easier for incident responders, analysts, and cybersecurity enthusiasts. This project wasn’t just a standalone idea—it was branded under the Exploit.to umbrella, aligning with my goal of creating practical and accessible solutions for security challenges.
The Exploit.to logo
If you haven’t explored Exploit.to, it’s worth checking out. The website hosts a range of open-source intelligence (OSINT) tools that are not only free but also incredibly handy for tasks like gathering public information, analyzing potential threats, and streamlining security workflows. You can find these tools here: https://exploit.to/tools/osint/.
Technologies Behind Sandkiste.io: Building a Robust and Scalable Solution
Sandkiste.io has been, and continues to be, an ambitious project that combines a variety of technologies to deliver speed, reliability, and flexibility. Like many big ideas, it started small—initially leveraging RabbitMQ, custom Golang scripts, and chromedp to handle tasks like web analysis. However, as the project evolved and my vision grew clearer, I transitioned to my favorite tech stack, which offers the perfect blend of power and simplicity.
Here’s the current stack powering Sandkiste.io:
Django & Django REST Framework
At the heart of the application is Django, a Python-based web framework known for its scalability, security, and developer-friendly features. Coupled with Django REST Framework (DRF), it provides a solid foundation for building robust APIs, ensuring smooth communication between the backend and frontend.
Celery
For task management, Celery comes into play. It handles asynchronous and scheduled tasks, ensuring the system can process complex workloads—like analyzing multiple URLs—without slowing down the user experience. It is easily integrated into Django and the developer experience and ecosystem around it is amazing.
Redis
Redis acts as the message broker for Celery and provides caching support. Its lightning-fast performance ensures tasks are queued and processed efficiently. Redis is and has been my go to although I did enjoy RabbitMQ a lot.
PostgreSQL
For the database, I chose PostgreSQL, a reliable and feature-rich relational database system. Its advanced capabilities, like full-text search and JSONB support, make it ideal for handling complex data queries. The full-text search works perfect with Django, here is a very detailed post about it.
FastAPI
FastAPI adds speed and flexibility to certain parts of the system, particularly where high-performance APIs are needed. Its modern Python syntax and automatic OpenAPI documentation make it a joy to work with. It is used to decouple the Scraper logic, since I wanted this to be a standalone project called “Scraproxy“.
Playwright
For web scraping and analysis, Playwright is the backbone. It’s a modern alternative to Selenium, offering cross-browser support and powerful features for interacting with websites in a headless (or visible) manner. This ensures that even complex, JavaScript-heavy sites can be accurately analyzed. The killer feature is how easy it is to capture a video and record network activity, which are basically the two main features needed here.
React with Tailwind CSS and shadcn/ui
On the frontend, I use React for building dynamic user interfaces. Paired with TailwindCSS, it enables rapid UI development with a clean, responsive design. shadcn/ui (a component library based on Radix) further enhances the frontend by providing pre-styled, accessible components that align with modern design principles.
This combination of technologies allows Sandkiste.io to be fast, scalable, and user-friendly, handling everything from backend processing to an intuitive frontend experience. Whether you’re inspecting URLs, performing in-depth analysis, or simply navigating the site, this stack ensures a seamless experience. I also have the most experience with React and Tailwind 😁.
Features of Sandkiste.io: What It Can Do
Now that you know the technologies behind Sandkiste.io, let me walk you through what this platform is capable of. Here are the key features that make Sandkiste.io a powerful tool for analyzing and inspecting websites safely and effectively:
Certificate Lookups
One of the fundamental features is the ability to perform certificate lookups. This lets you quickly fetch and review SSL/TLS certificates for a given domain. It’s an essential tool for verifying the authenticity of websites, identifying misconfigurations, or detecting expired or suspicious certificates. We use it a lot to find possibly generated subdomains and to get a better picture of the adversary infrastructure, it helps with recon in general. I get the info from crt.sh, they offer an exposed SQL database for these lookups.
DNS Records
Another key feature of Sandkiste.io is the ability to perform DNS records lookups. By analyzing a domain’s DNS records, you can uncover valuable insights about the infrastructure behind it, which can often reveal patterns or tools used by adversaries.
DNS records provide critical information about how a domain is set up and where it points. For cybersecurity professionals, this can offer clues about:
Hosting Services: Identifying the hosting provider or server locations used by the adversary.
Mail Servers: Spotting potentially malicious email setups through MX (Mail Exchange) records.
Subdomains: Finding hidden or exposed subdomains that may indicate a larger infrastructure or staging areas.
IP Addresses: Tracing A and AAAA records to uncover the IP addresses linked to a domain, which can sometimes reveal clusters of malicious activity.
DNS Security Practices: Observing whether DNSSEC is implemented, which might highlight the sophistication (or lack thereof) of the adversary’s setup.
By checking DNS records, you not only gain insights into the domain itself but also start piecing together the tools and services the adversary relies on. This can be invaluable for identifying common patterns in malicious campaigns or for spotting weak points in their setup that you can exploit to mitigate threats.
HTTP Requests and Responses Analysis
One of the core features of Sandkiste.io is the ability to analyze HTTP requests and responses. This functionality is a critical part of the platform, as it allows you to dive deep into what’s happening behind the scenes when a webpage is loaded. It reveals the files, scripts, and external resources that the website requests—many of which users never notice.
When you visit a webpage, the browser makes numerous background requests to load additional resources like:
JavaScript files
CSS stylesheets
Images
APIs
Third-party scripts or trackers
These requests often tell a hidden story about the behavior of the website. Sandkiste captures and logs every requests. Every HTTP request made by the website is logged, along with its corresponding response. (Jup, we store the raw data as well). For security professionals, monitoring and understanding these requests is essential because:
Malicious Payloads: Background scripts may contain harmful code or trigger the download of malware.
Unauthorized Data Exfiltration: The site might be sending user data to untrusted or unexpected endpoints.
Suspicious Third-Party Connections: You can spot connections to suspicious domains, which might indicate phishing attempts, tracking, or other malicious activities.
Alerts for Security Teams: Many alerts in security monitoring tools stem from these unnoticed, automatic requests that trigger red flags.
Security Blocklist Check
The Security Blocklist Check is another standout feature of Sandkiste.io, inspired by the great work at web-check.xyz. The concept revolves around leveraging malware-blocking DNS servers to verify if a domain is blacklisted. But I took it a step further to make it even more powerful and insightful.
Instead of simply checking whether a domain is blocked, Sandkiste.io enhances the process by using a self-hosted AdGuard DNS server. This server doesn’t just flag blocked domains—it captures detailed logs to provide deeper insights. By capturing logs from the DNS server, Sandkiste.io doesn’t just say “this domain is blacklisted.” It identifies why it’s flagged and where the block originated, this enables me to assign categories to the domains. The overall scores tells you very quickly if the page is safe or not.
Video of the Session
One of the most practical features of Sandkiste.io is the ability to create a video recording of the session. This feature was the primary reason I built the platform—because a single screenshot often falls short of telling the full story. With a video, you gain a complete, dynamic view of what happens during a browsing session.
Static screenshots capture a single moment in time, but they don’t show the sequence of events that can provide critical insights, such as:
Pop-ups and Redirects: Videos reveal if and when pop-ups appear or redirects occur, helping analysts trace how users might be funneled into malicious websites or phishing pages.
Timing of Requests: Understanding when specific requests are triggered can pinpoint what actions caused them, such as loading an iframe, clicking a link, or executing a script.
Visualized Responses: By seeing the full process—what loads, how it behaves, and the result—you get a better grasp of the website’s functionality and intent.
Recreating the User Journey: Videos enable you to recreate the experience of a user who might have interacted with the target website, helping you diagnose what happened step by step.
A video provides a much clearer picture of the target website’s behavior than static tools alone.
How Sandkiste.io Works: From Start to Insight
Using Sandkiste.io is designed to be intuitive and efficient, guiding you through the analysis process step by step while delivering detailed, actionable insights.
You kick things off by simply starting a scan. Once initiated, you’re directed to a loading page, where you can see which tasks (or “workers”) are still running in the background.
This page keeps you informed without overwhelming you with unnecessary technical details.
The Results Page
Once the scan is complete, you’re automatically redirected to the results page, where the real analysis begins. Let’s break down what you’ll see here:
Video Playback
At the top, you’ll find a video recording of the session, showing everything that happened after the target webpage was loaded. This includes:
Pop-ups and redirects.
The sequence of loaded resources (scripts, images, etc.).
Any suspicious behavior, such as unexpected downloads or external connections.
This video gives you a visual recap of the session, making it easier to understand how the website behaves and identify potential threats.
Detected Technologies
Below the video, you’ll see a section listing the technologies detected. These are inferred from response headers and other site metadata, and they can include:
Web frameworks (e.g., Django, WordPress).
Server information (e.g., Nginx, Apache).
This data is invaluable for understanding the website’s infrastructure and spotting patterns that could hint at malicious setups.
Statistics Panel
On the right side of the results page, there’s a statistics panel with several semi-technical but insightful metrics. Here’s what you can learn:
Size Percentile:
Indicates how the size of the page compares to other pages.
Why it matters: Unusually large pages can be suspicious, as they might contain obfuscated code or hidden malware.
Number of Responses:
Shows how many requests and responses were exchanged with the server.
Why it matters: A high number of responses could indicate excessive tracking, unnecessary redirects, or hidden third-party connections.
Duration to “Network Idle”:
Measures how long it took for the page to fully load and stop making network requests.
Why it matters: Some pages continue running scripts in the background even after appearing fully loaded, which can signal malicious or resource-intensive behavior.
Redirect Chain Analysis:
A list of all redirects encountered during the session.
Why it matters: A long chain of redirects is a common tactic in phishing, ad fraud, or malware distribution campaigns.
By combining these insights—visual evidence from the video, infrastructure details from detected technologies, and behavioral stats from the metrics—you get a comprehensive view of the website’s behavior. This layered approach helps security analysts identify potential threats with greater accuracy and confidence.
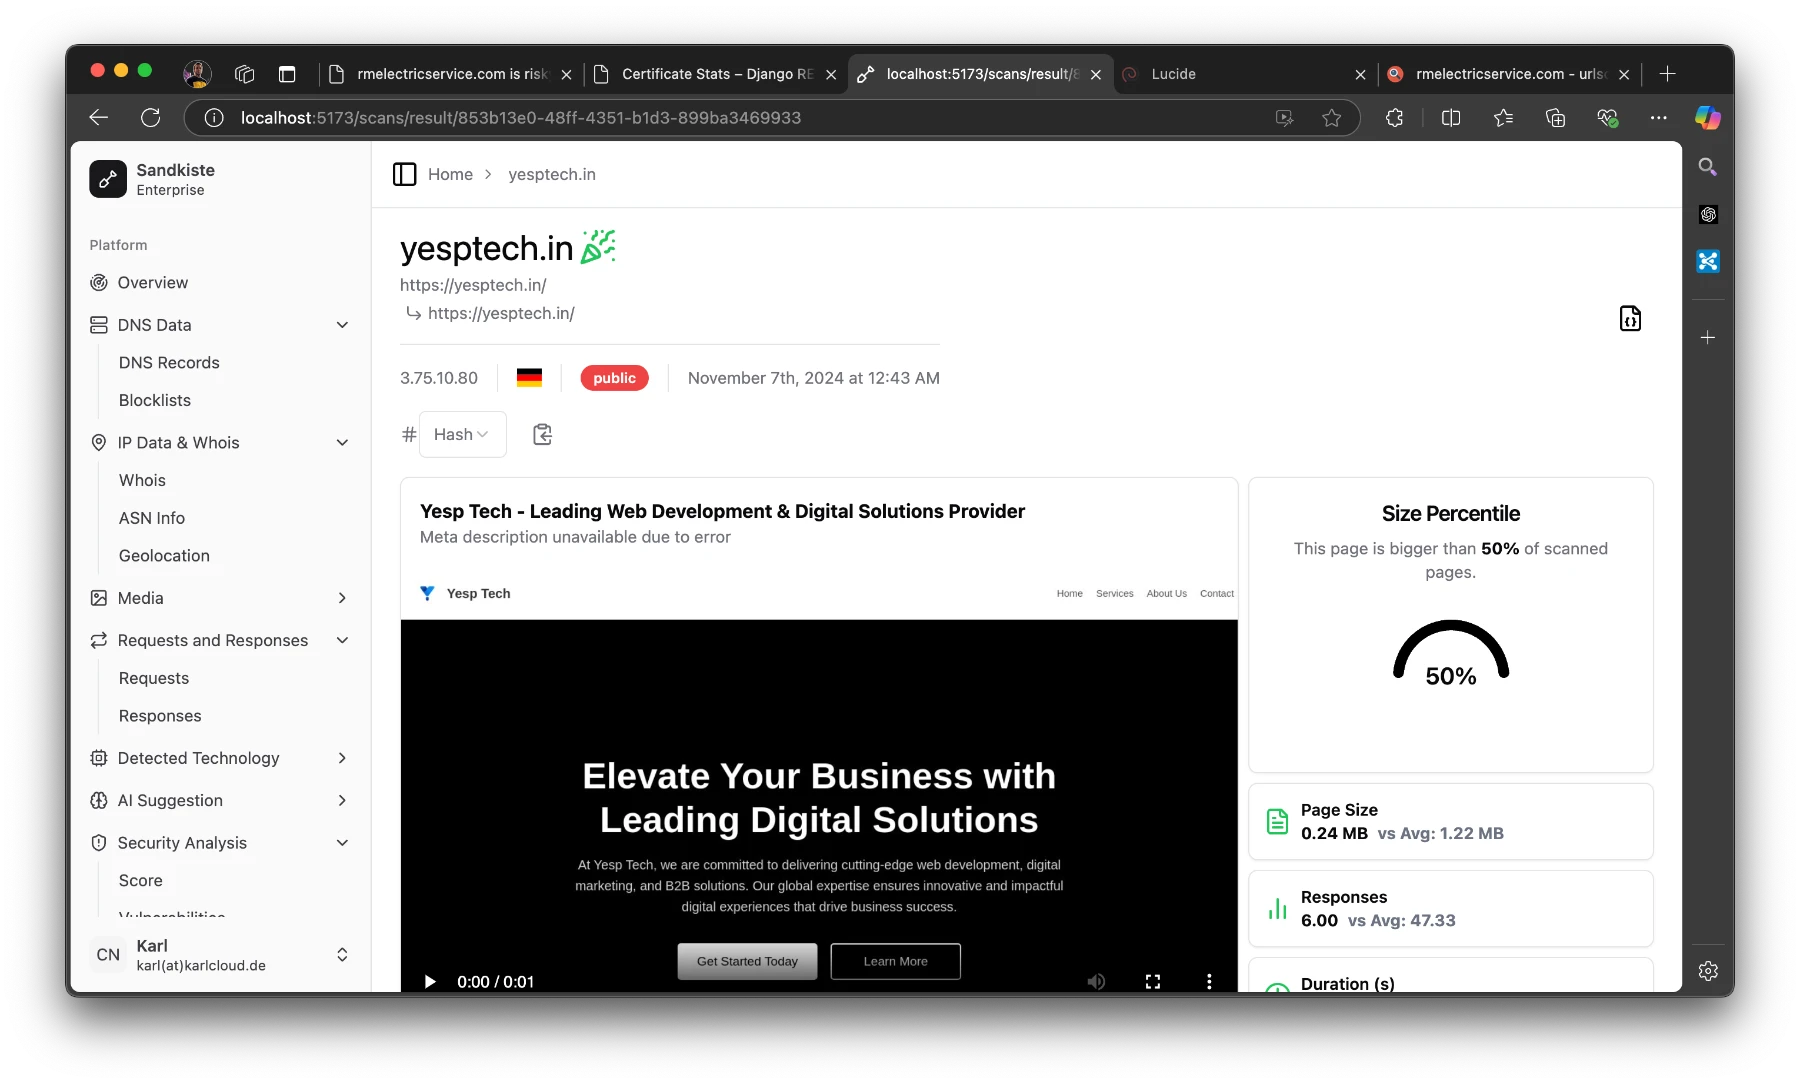
At the top of the page, you’ll see the starting URL and the final URL you were redirected to.
“Public” means that others can view the scan.
The German flag indicates that the page is hosted in Germany.
The IP address shows the final server we landed on.
The party emoji signifies that the page is safe; if it weren’t, you’d see a red skull (spooky!). Earlier, I explained the criteria for flagging a page as good or bad.
On the “Responses” page I mentioned earlier, you can take a closer look at them. Here, you can see exactly where the redirects are coming from and going to. I’ve added a red shield icon to clearly indicate when HTTP is used instead of HTTPS.
As an analyst, it’s pretty common to review potentially malicious scripts. Clicking on one of the results will display the raw response safely. In the image below, I clicked on that long JavaScript URL (normally a risky move, but in Sandkiste, every link is completely safe!).
Conclusion
And that’s the story of Sandkiste.io, a project I built over the course of a month in my spare time. While the concept itself was exciting, the execution came with its own set of challenges. For me, the toughest part was achieving a real-time feel for the user experience while ensuring the asynchronous jobs running in the background were seamlessly synced back together. It required a deep dive into task coordination and real-time updates, but it taught me lessons that I now use with ease.
Currently, Sandkiste.io is still in beta and runs locally within our company’s network. It’s used internally by my team to streamline our work and enhance our incident response capabilities. Though it’s not yet available to the public, it has already proven its value in simplifying complex tasks and delivering insights that traditional tools couldn’t match.
Future Possibilities
While it’s an internal tool for now, I can’t help but imagine where this could go.
For now, Sandkiste.io remains a testament to what can be built with focus, creativity, and a drive to solve real-world problems. Whether it ever goes public or not, this project has been a milestone in my journey, and I’m proud of what it has already achieved. Who knows—maybe the best is yet to come!
Let’s face it—this is a pretty specific use case. But if you’ve ever had your internet throttled, you’ll understand why I’m doing this. I wanted a way to store my router connectivity data for up to a year to have solid proof (and maybe even get some money back from my ISP). Here’s what my setup looks like:
Log Server: Running Grafana, Loki, Promtail, rsyslog, and InfluxDB.
Home Assistant: I run the OS version. Judge me if you must—yes, the Docker version is way more lightweight, but I like the simplicity of the OS version.
FRITZ!Box: My modem, with a Dream Machine handling the rest of my network behind it.
For those curious about Home Assistant on Proxmox, the easiest method is using the Proxmox VE Helper Scripts. There’s also a detailed blog post I found about other installation methods if you’re exploring your options.
A more detailed look on my setup
Proxmox
Proxmox Virtual Environment (VE) is the backbone of my setup. It’s a powerful, open-source virtualization platform that allows you to run virtual machines and containers efficiently. I use it to host Home Assistant, my logging stack, and other services, all on a single physical server. Proxmox makes resource allocation simple and offers great features like snapshots, backups, and an intuitive web interface. It’s perfect for consolidating multiple workloads while keeping everything isolated and manageable.
FRITZ!Box
The FRITZ!Box is one of the most popular home routers in Germany, developed by AVM Computersysteme Vertriebs GmbH. It’s known for its reliability and user-friendly features. I use it as my primary modem, and I’ve configured it to forward logs about internet connectivity and other metrics to my logging stack. If you’re curious about their lineup, check out their products here.
Home Assistant
Home Assistant is my go-to for managing smart home devices, and I run the OS version (yes, even though the Docker version is more lightweight). It’s incredibly powerful and integrates with almost any device. I use it to collect data from the FRITZ!Box and send it to my logging setup. If you’re using Proxmox, installing Home Assistant is a breeze with the Proxmox VE Helper Scripts.
The Logserver
I run all of these services on a Debian LXC inside of my Proxmox. I assigned the following resources to it:
RAM: 2GB
SWAP: 2GB
Cores: 2
Disk: 100GB (NVMe SSD,)
As I later realized, 100GB are overkill. For 30 days of data I need about 5GB of Storage. My log retention policy is currently set to 30 days, but my InfluxDB retention is Bucket based, so that I need to watch.
I still do have a lot of duplicate logs and more or less useless systems logs I never look at, so I can probably improve this by a lot.
Grafana
Grafana is, in my opinion, one of the best free tools for visualizing logs and metrics. It allows you to create beautiful, customizable dashboards that make it easy to monitor your data at a glance. Plus, it integrates seamlessly with Loki, InfluxDB, and many other tools.
Think of Loki as a “database for logs.” It doesn’t require complex indexing like traditional logging systems, which makes it lightweight and efficient. Once your logs are sent to Loki, you can easily search, filter, and analyze them through Grafana.
Promtail is an agent that collects logs from your local system and sends them to Loki. For example, you can point it to your /var/log/directory, set up rules to pick specific logs (like system or router logs), and Promtail will forward those logs to your Loki instance. It’s simple to configure and keeps everything organized.
This is a flexible logging system that can forward or store logs. In my setup, it collects logs from devices like routers and firewalls—especially those where you can’t easily install an agent or service—and makes those logs available for Promtail to pick up and send to Loki.
InfluxDB is one of the most popular time-series databases, perfect for storing numerical data over time, like network speeds or uptime metrics. I use it alongside Grafana to visualize long-term trends in my router’s performance.
Metrics track numerical trends over time (e.g., CPU usage, internet speed), while logs provide detailed event records (e.g., an error message when your router loses connection). Both are incredibly useful for troubleshooting and monitoring, especially when used together.
In this post, I’ll show you how I’ve tied all these tools together to monitor my internet connectivity and keep my ISP accountable. Let’s get started!
Setting up Home Assistant with InfluxDB
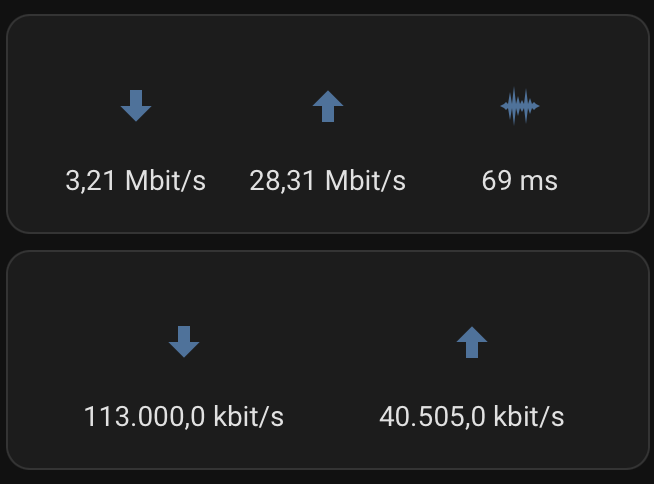
In Home Assistant, I have a dashboard that shows the internet speed my devices are getting within the network, along with the speeds my FRITZ!Box is receiving from my ISP. Don’t worry about the big difference in download speeds—I’m currently syncing a bunch of backups, which is pulling a lot of data.
Home Assistant keeps data from the FRITZ!Box for only 10 days, which isn’t enough to prove to my ISP that they’re throttling my connection. A technician came by today, which is why my download speeds are back to normal. However, as you can see here, they had me on a slower speed before that.
In Home Assistant, you can adjust data retention with the Recorder, but this applies to all sensors, which was a bit annoying in my case since I only wanted to keep data for specific entities for a year. Since I already use Grafana for other visualizations and have InfluxDB running, I decided to take that route instead.
Home Assistant conveniently includes a built-in integration to export metrics directly to InfluxDB, making the setup straightforward.
In InfluxDB, I created a new bucket specifically for this data—who knows, I might add more Home Assistant data there someday! I’ve set it to store data for two years, but if I ever run out of space, I can always adjust it. 😁
Next, I created a new API token for the bucket. I opted for both read and write permissions, just in case I ever want to pull data from InfluxDB back into Home Assistant.
In the Home Assistant file editor you simply have to edit your configuration.yaml
You can find the organization ID for your InfluxDB organization by clicking the user icon in the top left and selecting “About” at the bottom of the page. That’s where the ID is listed. As you can see, I’m using port 443 because my setup uses HTTPS and is behind a reverse proxy. If you’re interested in setting up HTTPS with a reverse proxy, check out my post How to Get Real Trusted SSL Certificates with ACME-DNS in Nginx Proxy Manager.
Once everything is configured, restart Home Assistant. Go to the Data Explorer tab in your InfluxDB UI to verify that data is flowing into your bucket.
The Grafana Dashboard
Alright, please don’t judge my dashboard too harshly! I’m still learning the ropes here. I usually rely on prebuilt ones, but this is my first attempt at creating one from scratch to help me learn.
You’ll need to check the Explore tab in Grafana to find your specific entities, but here are the queries I used for reference:
The filter for the entity ID comes from Home Assistant. You can easily find it on your dashboard by double-clicking (or double-tapping) the widget and checking its settings.
You do the same for Upload
Keep in mind that the upload speed is only measured every few hours by your FRITZ!Box.
The query for this is quite similar, as you can see.
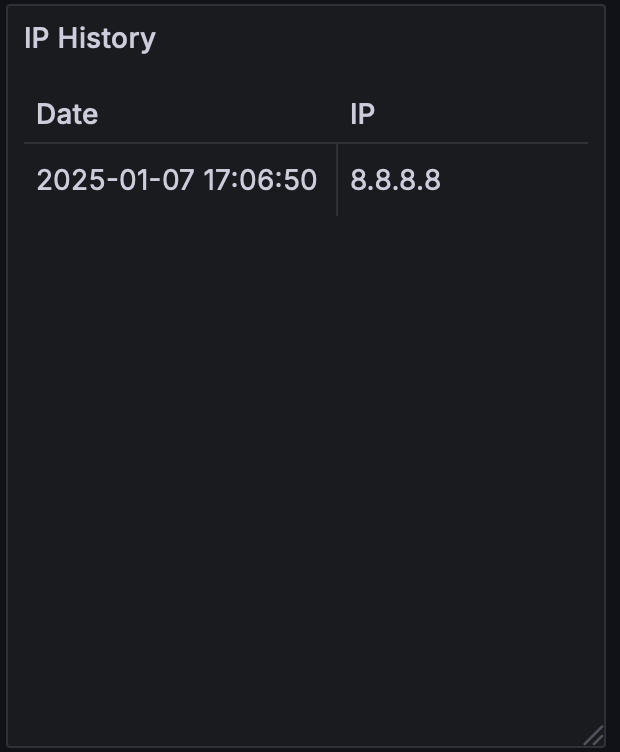
Now, here’s the tricky part: extracting your public IP from the FRITZ!Box metrics. Out of the box, the metrics sent to InfluxDB seem to be messed up—maybe I did something wrong (feel free to comment and let me know 😁). To handle this, I wrote a filter that checks if an IP is present. I kept running into errors, so I ended up casting everything to a string before applying the check. Since my IP doesn’t change often (about once a week), I use a range of -30 days for the query:
Now, you’ll get a neat little table showing the changes to your public IP (don’t worry, I’ve changed my public IP for obvious reasons). It’s a simple way to keep track of when those changes happen!
I’m planning to write a longer post about how I set up my logging server and connected all these pieces together. But for now, I just wanted to share what I worked on tonight and how I can now hold my ISP accountable if I’m not getting what I paid for—or, as is often the case, confirm if it’s actually my fault 😅.
If you deployed Nginx Proxy Manager via Docker in your home directory you can edit this file with
nano~/data/nginx/custom/http.conf
All you need to do is add the following at the top:
http.conf
more_set_headers'Server: CuteKitten';
Then, restart your Nginx Proxy Manager. If you’re using Docker, like I am, a simple docker compose restart will do the trick.
With this, the custom Server header will be applied to every request, including those to the Nginx Proxy Manager UI itself. If you check the response headers of this website, you’ll see the header I set—proof of how easy and effective this customization can be!
Understanding more_set_headers vs add_header
When working with Nginx Proxy Manager, you may encounter two ways to handle HTTP headers:
add_header
more_set_headers
What is add_header?
add_header is a built-in Nginx directive that allows you to add new headers to your HTTP responses. It’s great for straightforward use cases where you just want to include additional information in your response headers.
What is more_set_headers?
more_set_headers is part of the “headers_more” module, an extension not included in standard Nginx but available out of the box with Nginx Proxy Manager(since it uses OpenResty). This directive gives you much more flexibility:
It can add, overwrite, or remove headers entirely.
It works seamlessly with Nginx Proxy Manager, so there’s no need to install anything extra.
You don’t need to modify or remove existing headers.
Example:
add_header X-Frame-OptionsSAMEORIGIN;
Use more_set_headers if:
You need to replace or remove existing headers, such as Server or X-Powered-By.
You want headers to apply to all responses, including error responses (e.g., 404, 500).
Example:
# Replace the default Nginx Server headermore_set_headers "Server: MyCustomServer";
Why Use more_set_headers?
The key advantage of more_set_headers is that it provides full control over your headers. For example:
If you want to customize the Server header, add_header won’t work because the Server header is already set internally by Nginx, you would have to remove it first.
more_set_headers can replace the Server header or even remove it entirely, which is particularly useful for security or branding purposes.
Since Nginx Proxy Manager includes the headers_more module by default, using more_set_headers is effortless and highly recommended for advanced header management.
A Note on Security
Many believe that masking or modifying the Server header improves security by hiding the server software you’re using. The idea is that attackers who can’t easily identify your web server (e.g., Nginx, Apache, OpenResty) or its version won’t know which exploits to try.
While this may sound logical, it’s not a foolproof defense:
Why It May Be True: Obscuring server details could deter opportunistic attackers who rely on automated tools that scan for specific server types or versions.
Why It May Be False: Determined attackers can often gather enough information from other headers, server behavior, or fingerprinting techniques to deduce what you’re running, regardless of the Server header.
Ultimately, changing the Server header should be seen as one small layer in a broader security strategy, not as a standalone solution. Real security comes from keeping your software updated, implementing proper access controls, and configuring firewalls—not just masking headers.
Welcome to the realm of the hidden, where shadows dance and whispers echo through the digital corridors. Enter Gottor, a testament to curiosity, innovation, and a touch of madness. In this blog post, we embark on a journey through the creation of Gottor, a bespoke dark web search engine that defies convention and pushes the boundaries of exploration.
Genesis of an Idea
The genesis of Gottor traces back to a spark of inspiration shared between friends, fueled by a desire to unveil the secrets lurking within the depths of the dark web. Drawing parallels to Shodan, but with a cloak of obscurity, we set out on a quest to build our own gateway to the clandestine corners of the internet.
Forging Custom Solutions
Determined to forge our path, we eschewed conventional wisdom and opted for custom solutions. Rejecting standard databases, we crafted our own using the robust framework of BleveSearch, laying the foundation for a truly unique experience. With a simple Tor proxy guiding our way, we delved deeper, fueled by an insatiable thirst for performance.
However, our zeal for efficiency proved to be a double-edged sword, as our relentless pursuit often led to blacklisting. Undeterred, we embraced the challenge, refining our approach through meticulous processing and data extraction. Yet, the onslaught of onion sites proved overwhelming, prompting a shift towards the versatile embrace of Scrapy.
The Turning Point
Amidst the trials and tribulations, a revelation emerged – the adoption of Ahmias’ tor proxy logic with Polipo. Through the ingenious utilization of multiple Tor entry nodes and a strategic round-robin approach, we achieved equilibrium, evading the ire of blacklisting and forging ahead with renewed vigor.
The Ethical Conundrum
As our creation took shape, we faced an ethical conundrum that cast a shadow over our endeavors. Consulting with legal counsel, we grappled with the implications of anonymity and the responsibility inherent in our pursuit. Ultimately, discretion prevailed, and Gottor remained veiled, a testament to the delicate balance between exploration and accountability.
Unveiling the Web of Intrigue
In our quest for knowledge, we unearthed a web of intrigue, interconnected and teeming with hidden services. By casting our digital net wide, we traversed the labyrinthine pathways, guided by popular indexers and a relentless spirit of inquiry. What emerged was a tapestry of discovery, illuminating the clandestine landscape with each query and click.
Lessons Learned
Through the crucible of creation, we gained a newfound appreciation for the intricacies of search engines. While acquiring and storing data proved relatively straightforward, the true challenge lay in making it accessible, particularly amidst the myriad complexities of multilingual content. Yet, amidst the obstacles, we discovered the essence of exploration – a journey defined by perseverance, innovation, and the relentless pursuit of knowledge.
In conclusion, Gottor stands as a testament to the boundless curiosity that drives us to explore the uncharted territories of the digital realm. Though shrouded in secrecy, its legacy endures, an embodiment of the relentless pursuit of understanding in an ever-evolving landscape of discovery.
Explore. Discover. Gottor
.
Although we have not talked in years. Shoutout to my good friend Milan who helped make this project possible.
This project spans over 3 years with countless iterations and weeks of coding. I wrote almost 500,000 lines of code in Python and Javascript. The essential idea was to use a shorting strategy on put/call options to generate income based on time decay – also called “Theta”. You kind of have to know a little bit about how stock options work to understand this next part, but here I go. About 80% of all options expire worthless; statistically, you have a way higher chance shorting options and making a profit than going long. The further the strike price is from the price of the underlying stock, the higher the probability of the option expiring worthless. Technically, you always make 100%.
Now back to reality, where things aren’t perfect.
A lot can happen in the market. If you put your life savings into a seemingly safe trade (with Stonkmarket actually +95% safe, more on that later) then the next Meta scandal gets published and the trade goes against you. When shorting, you can actually lose more than 100% (since stocks can virtually rise to infinity), but you can only gain 100%. It sounds like a bad deal, but again, you can gain 100% profit a lot more than infinite losses, although the chance is never 0. The trick is to use stop loss, but risk management is obviously part of it when you trade for a living.
DoD Scraper
The idea actually started as a simple idea to scrape the U.S. Department of Defense contracts to predict the earnings of large weapons companies and make large option trades based upon that.
Spoiler: It is not that easy. You can get lucky if the company is small enough and traded on the stock market, so it actually makes a huge impact on their financials. A company like Lockheed Martin is not really predictable by DoD contracts alone.
Back then I called it Wallabe and this was the logo:
More data
I didn’t know the idea was bad, so I soon started to scrape news. I collected over 100 RSS feeds, archiving them, analyzing them, and making them accessible via a REST API. Let me tell you, I got a lot of news. Some people sell this data, but honestly, it was a lot more worth to me in my database enriching my decision-making algo.
I guess it goes without saying that I was also collecting stock data including fundamental and earnings information; that is kind of the base for everything. Do you know how many useful metrics you can calculate with the data listed above alone? A lot. Some of them tell you the same stuff, true, but nonetheless, you can generate a lot.
Bearbot is born
Only works on dark mode, sorry.
As I was writing this into a PWA (website that acts as a mobile app), I was reading up on how to use option Greeks to calculate stock prices when realizing that it is a lot easier to predict and set up options trades. That is when I started to gather a whole bunch of options data and calculating my own Greeks which led me to explore more about theta and likelihood of options expiring worthless.
From that point on, I invested all the time asking the following question: What is the perfect environment for shorting Option XYZ?
The answer is generally quite simple:
little volatility
not a lot of news
going with the general trend
Delta “probability” is in your favor
You can really expand on these 3 points, and there are many ways to calculate and measure them, but that’s basically it. If you know a thing about trading, ask yourself this, what does the perfect time for a trade look like? Try to quantify it, should a stock have just gone down 20%, then released good news and something else? If yes, then what if you had a program to spot exactly these moments all over the stock market and alert you of those amazing chances to pretty much print money? That’s Bearbot.
Success
At the beginning, I actually planned on selling this and offering it as a service like all those other signal trading services or whatever, but honestly, why the hell would I give you something that sounds (and was) so amazing that I could practically print money? There is no value for me. Nobody is going to sell or offer you a trading strategy that works, unless it works by a lot of people knowing about it and doing it like candlestick patterns.
Failure
The day I started making a lot more money than with my regular job was the day I lost my mind. I stopped listening to Bearbot. I know it kind of sounds silly talking about it, but I thought none of my trades could go wrong and I didn’t need it anymore; I had developed some sort of gift for trading. I took on too much risk and took a loss so big saying the number would send shivers down your spine, unless you’re rich. Bearbot was right with the trade, but by not having enough to cover margin, I got a margin call and my position was closed. I got caught by a whipsaw (it was a Meta option and they had just announced a huge data leak).
”Learning” from my mistakes
In the real world, not everything has an API. I spent weeks reversing the platform I was trading to automate the bot entirely without having to do anything in hopes of removing the human error-prone element. The problem was that they did not want bot traders, so they did a lot to counter it, and every 2 weeks I had to adjust the bot or else get captchas or blocked directly. Eventually, it reached a very unstable point to where I could not use it for live trading anymore since I could not trust it in closing positions on time.
I was very sad at that point. Discouraged, I discontinued Bearbot for about a year.
Stonkmarket: Rising
Some time went on until a friend of mine encouraged me to try again.
I decided to take a new approach. New architecture, new style, new name. I wanted to leave all the negative stuff behind. It had 4 parts:
central API with a large database (Django Rest Framework)
local scrapers (Python, Selenium)
static React-based front end
“Stonk, the Bot” a Discord bot for signals and monitoring
I extended the UI a lot showing all the data I have gathered but sadly I also shut down the entire backend before writing this so I cannot show it with data.
I spent about 3 months refactoring the old code, getting it to work, and putting it into a new structure. I then started trading again, and everything was well.
Final Straw
I was going through a very stressful phase, and on top of it, one scraper after the other was failing. It got to a point where I had to continuously change logic around and fix my data kraken, and I could not maintain it alone anymore. I also couldn’t let anyone in on it as I did not want to publish my code and open things up to reveal my secrets. It was at this point where I decided to shut it down for good. I poured 3 years, countless hours, lines of code, research, and even tears into this project. I learned more than on any other project ever.
Summary
On this project, I really mastered Django and Django Rest Framework, I experimented a lot with PWAs and React, pushing my web development knowledge. On top of that, I was making good money trading, but the stress and greed eventually got to me until I decided I was better off shutting it down. If you read this and know me, you probably know all about Bearbot and Stonkmarket, and maybe I have even given you a trade or 2 that you profited off of. Maybe one day I will open-source the code for this; that will be the day I am truly finished with Stonkmarket. For now, a small part inside myself is still thinking it is possible to redo it.
Better than ever, cooler than ever! You cannot beat this bear.
Manage Consent
To provide the best experiences, we use technologies like cookies to store and/or access device information. Consenting to these technologies will allow us to process data such as browsing behavior or unique IDs on this site. Not consenting or withdrawing consent, may adversely affect certain features and functions.
Functional
Always active
The technical storage or access is strictly necessary for the legitimate purpose of enabling the use of a specific service explicitly requested by the subscriber or user, or for the sole purpose of carrying out the transmission of a communication over an electronic communications network.
Preferences
The technical storage or access is necessary for the legitimate purpose of storing preferences that are not requested by the subscriber or user.
Statistics
The technical storage or access that is used exclusively for statistical purposes.The technical storage or access that is used exclusively for anonymous statistical purposes. Without a subpoena, voluntary compliance on the part of your Internet Service Provider, or additional records from a third party, information stored or retrieved for this purpose alone cannot usually be used to identify you.
Marketing
The technical storage or access is required to create user profiles to send advertising, or to track the user on a website or across several websites for similar marketing purposes.