As a principal incident responder, my team and I often face the challenge of analyzing potentially malicious websites quickly and safely. This work is crucial, but it can also be tricky, especially when it risks compromising our test environments. Burning through test VMs every time we need to inspect a suspicious URL is far from efficient.
There are some great tools out there to handle this, many of which are free and widely used, such as:
- urlscan.io – A tool for visualizing and understanding web requests.
- VirusTotal – Renowned for its file and URL scanning capabilities.
- Joe Sandbox – A powerful tool for detailed malware analysis.
- Web-Check – Another useful resource for URL scanning.
While these tools are fantastic for general purposes, I found myself needing something more tailored to my team’s specific needs. We needed a solution that was straightforward, efficient, and customizable—something that fit seamlessly into our workflows.
So, I decided to create it myself: Sandkiste.io. My goal was to build a smarter, more accessible sandbox for the web that not only matches the functionality of existing tools but offers the simplicity and flexibility we required for our day-to-day incident response tasks with advanced features (and a beautiful UI 🤩!).

Sandkiste.io is part of a larger vision I’ve been working on through my Exploit.to platform, where I’ve built a collection of security-focused tools designed to make life easier for incident responders, analysts, and cybersecurity enthusiasts. This project wasn’t just a standalone idea—it was branded under the Exploit.to umbrella, aligning with my goal of creating practical and accessible solutions for security challenges.

If you haven’t explored Exploit.to, it’s worth checking out. The website hosts a range of open-source intelligence (OSINT) tools that are not only free but also incredibly handy for tasks like gathering public information, analyzing potential threats, and streamlining security workflows. You can find these tools here: https://exploit.to/tools/osint/.
Technologies Behind Sandkiste.io: Building a Robust and Scalable Solution
Sandkiste.io has been, and continues to be, an ambitious project that combines a variety of technologies to deliver speed, reliability, and flexibility. Like many big ideas, it started small—initially leveraging RabbitMQ, custom Golang scripts, and chromedp to handle tasks like web analysis. However, as the project evolved and my vision grew clearer, I transitioned to my favorite tech stack, which offers the perfect blend of power and simplicity.
Here’s the current stack powering Sandkiste.io:
Django & Django REST Framework
At the heart of the application is Django, a Python-based web framework known for its scalability, security, and developer-friendly features. Coupled with Django REST Framework (DRF), it provides a solid foundation for building robust APIs, ensuring smooth communication between the backend and frontend.
Celery
For task management, Celery comes into play. It handles asynchronous and scheduled tasks, ensuring the system can process complex workloads—like analyzing multiple URLs—without slowing down the user experience. It is easily integrated into Django and the developer experience and ecosystem around it is amazing.
Redis
Redis acts as the message broker for Celery and provides caching support. Its lightning-fast performance ensures tasks are queued and processed efficiently. Redis is and has been my go to although I did enjoy RabbitMQ a lot.
PostgreSQL
For the database, I chose PostgreSQL, a reliable and feature-rich relational database system. Its advanced capabilities, like full-text search and JSONB support, make it ideal for handling complex data queries. The full-text search works perfect with Django, here is a very detailed post about it.
FastAPI
FastAPI adds speed and flexibility to certain parts of the system, particularly where high-performance APIs are needed. Its modern Python syntax and automatic OpenAPI documentation make it a joy to work with. It is used to decouple the Scraper logic, since I wanted this to be a standalone project called “Scraproxy“.
Playwright
For web scraping and analysis, Playwright is the backbone. It’s a modern alternative to Selenium, offering cross-browser support and powerful features for interacting with websites in a headless (or visible) manner. This ensures that even complex, JavaScript-heavy sites can be accurately analyzed. The killer feature is how easy it is to capture a video and record network activity, which are basically the two main features needed here.
React with Tailwind CSS and shadcn/ui
On the frontend, I use React for building dynamic user interfaces. Paired with TailwindCSS, it enables rapid UI development with a clean, responsive design. shadcn/ui (a component library based on Radix) further enhances the frontend by providing pre-styled, accessible components that align with modern design principles.
This combination of technologies allows Sandkiste.io to be fast, scalable, and user-friendly, handling everything from backend processing to an intuitive frontend experience. Whether you’re inspecting URLs, performing in-depth analysis, or simply navigating the site, this stack ensures a seamless experience. I also have the most experience with React and Tailwind 😁.
Features of Sandkiste.io: What It Can Do
Now that you know the technologies behind Sandkiste.io, let me walk you through what this platform is capable of. Here are the key features that make Sandkiste.io a powerful tool for analyzing and inspecting websites safely and effectively:
Certificate Lookups
One of the fundamental features is the ability to perform certificate lookups. This lets you quickly fetch and review SSL/TLS certificates for a given domain. It’s an essential tool for verifying the authenticity of websites, identifying misconfigurations, or detecting expired or suspicious certificates. We use it a lot to find possibly generated subdomains and to get a better picture of the adversary infrastructure, it helps with recon in general. I get the info from crt.sh, they offer an exposed SQL database for these lookups.

DNS Records
Another key feature of Sandkiste.io is the ability to perform DNS records lookups. By analyzing a domain’s DNS records, you can uncover valuable insights about the infrastructure behind it, which can often reveal patterns or tools used by adversaries.

DNS records provide critical information about how a domain is set up and where it points. For cybersecurity professionals, this can offer clues about:
- Hosting Services: Identifying the hosting provider or server locations used by the adversary.
- Mail Servers: Spotting potentially malicious email setups through MX (Mail Exchange) records.
- Subdomains: Finding hidden or exposed subdomains that may indicate a larger infrastructure or staging areas.
- IP Addresses: Tracing A and AAAA records to uncover the IP addresses linked to a domain, which can sometimes reveal clusters of malicious activity.
- DNS Security Practices: Observing whether DNSSEC is implemented, which might highlight the sophistication (or lack thereof) of the adversary’s setup.
By checking DNS records, you not only gain insights into the domain itself but also start piecing together the tools and services the adversary relies on. This can be invaluable for identifying common patterns in malicious campaigns or for spotting weak points in their setup that you can exploit to mitigate threats.
HTTP Requests and Responses Analysis
One of the core features of Sandkiste.io is the ability to analyze HTTP requests and responses. This functionality is a critical part of the platform, as it allows you to dive deep into what’s happening behind the scenes when a webpage is loaded. It reveals the files, scripts, and external resources that the website requests—many of which users never notice.

When you visit a webpage, the browser makes numerous background requests to load additional resources like:
- JavaScript files
- CSS stylesheets
- Images
- APIs
- Third-party scripts or trackers
These requests often tell a hidden story about the behavior of the website. Sandkiste captures and logs every requests. Every HTTP request made by the website is logged, along with its corresponding response. (Jup, we store the raw data as well). For security professionals, monitoring and understanding these requests is essential because:
- Malicious Payloads: Background scripts may contain harmful code or trigger the download of malware.
- Unauthorized Data Exfiltration: The site might be sending user data to untrusted or unexpected endpoints.
- Suspicious Third-Party Connections: You can spot connections to suspicious domains, which might indicate phishing attempts, tracking, or other malicious activities.
- Alerts for Security Teams: Many alerts in security monitoring tools stem from these unnoticed, automatic requests that trigger red flags.
Security Blocklist Check
The Security Blocklist Check is another standout feature of Sandkiste.io, inspired by the great work at web-check.xyz. The concept revolves around leveraging malware-blocking DNS servers to verify if a domain is blacklisted. But I took it a step further to make it even more powerful and insightful.

Instead of simply checking whether a domain is blocked, Sandkiste.io enhances the process by using a self-hosted AdGuard DNS server. This server doesn’t just flag blocked domains—it captures detailed logs to provide deeper insights. By capturing logs from the DNS server, Sandkiste.io doesn’t just say “this domain is blacklisted.” It identifies why it’s flagged and where the block originated, this enables me to assign categories to the domains. The overall scores tells you very quickly if the page is safe or not.
Video of the Session
One of the most practical features of Sandkiste.io is the ability to create a video recording of the session. This feature was the primary reason I built the platform—because a single screenshot often falls short of telling the full story. With a video, you gain a complete, dynamic view of what happens during a browsing session.

Static screenshots capture a single moment in time, but they don’t show the sequence of events that can provide critical insights, such as:
- Pop-ups and Redirects: Videos reveal if and when pop-ups appear or redirects occur, helping analysts trace how users might be funneled into malicious websites or phishing pages.
- Timing of Requests: Understanding when specific requests are triggered can pinpoint what actions caused them, such as loading an iframe, clicking a link, or executing a script.
- Visualized Responses: By seeing the full process—what loads, how it behaves, and the result—you get a better grasp of the website’s functionality and intent.
- Recreating the User Journey: Videos enable you to recreate the experience of a user who might have interacted with the target website, helping you diagnose what happened step by step.
A video provides a much clearer picture of the target website’s behavior than static tools alone.
How Sandkiste.io Works: From Start to Insight
Using Sandkiste.io is designed to be intuitive and efficient, guiding you through the analysis process step by step while delivering detailed, actionable insights.

You kick things off by simply starting a scan. Once initiated, you’re directed to a loading page, where you can see which tasks (or “workers”) are still running in the background.
This page keeps you informed without overwhelming you with unnecessary technical details.
The Results Page
Once the scan is complete, you’re automatically redirected to the results page, where the real analysis begins. Let’s break down what you’ll see here:

Video Playback
At the top, you’ll find a video recording of the session, showing everything that happened after the target webpage was loaded. This includes:
- Pop-ups and redirects.
- The sequence of loaded resources (scripts, images, etc.).
- Any suspicious behavior, such as unexpected downloads or external connections.
This video gives you a visual recap of the session, making it easier to understand how the website behaves and identify potential threats.
Detected Technologies
Below the video, you’ll see a section listing the technologies detected. These are inferred from response headers and other site metadata, and they can include:
- Web frameworks (e.g., Django, WordPress).
- Server information (e.g., Nginx, Apache).
This data is invaluable for understanding the website’s infrastructure and spotting patterns that could hint at malicious setups.
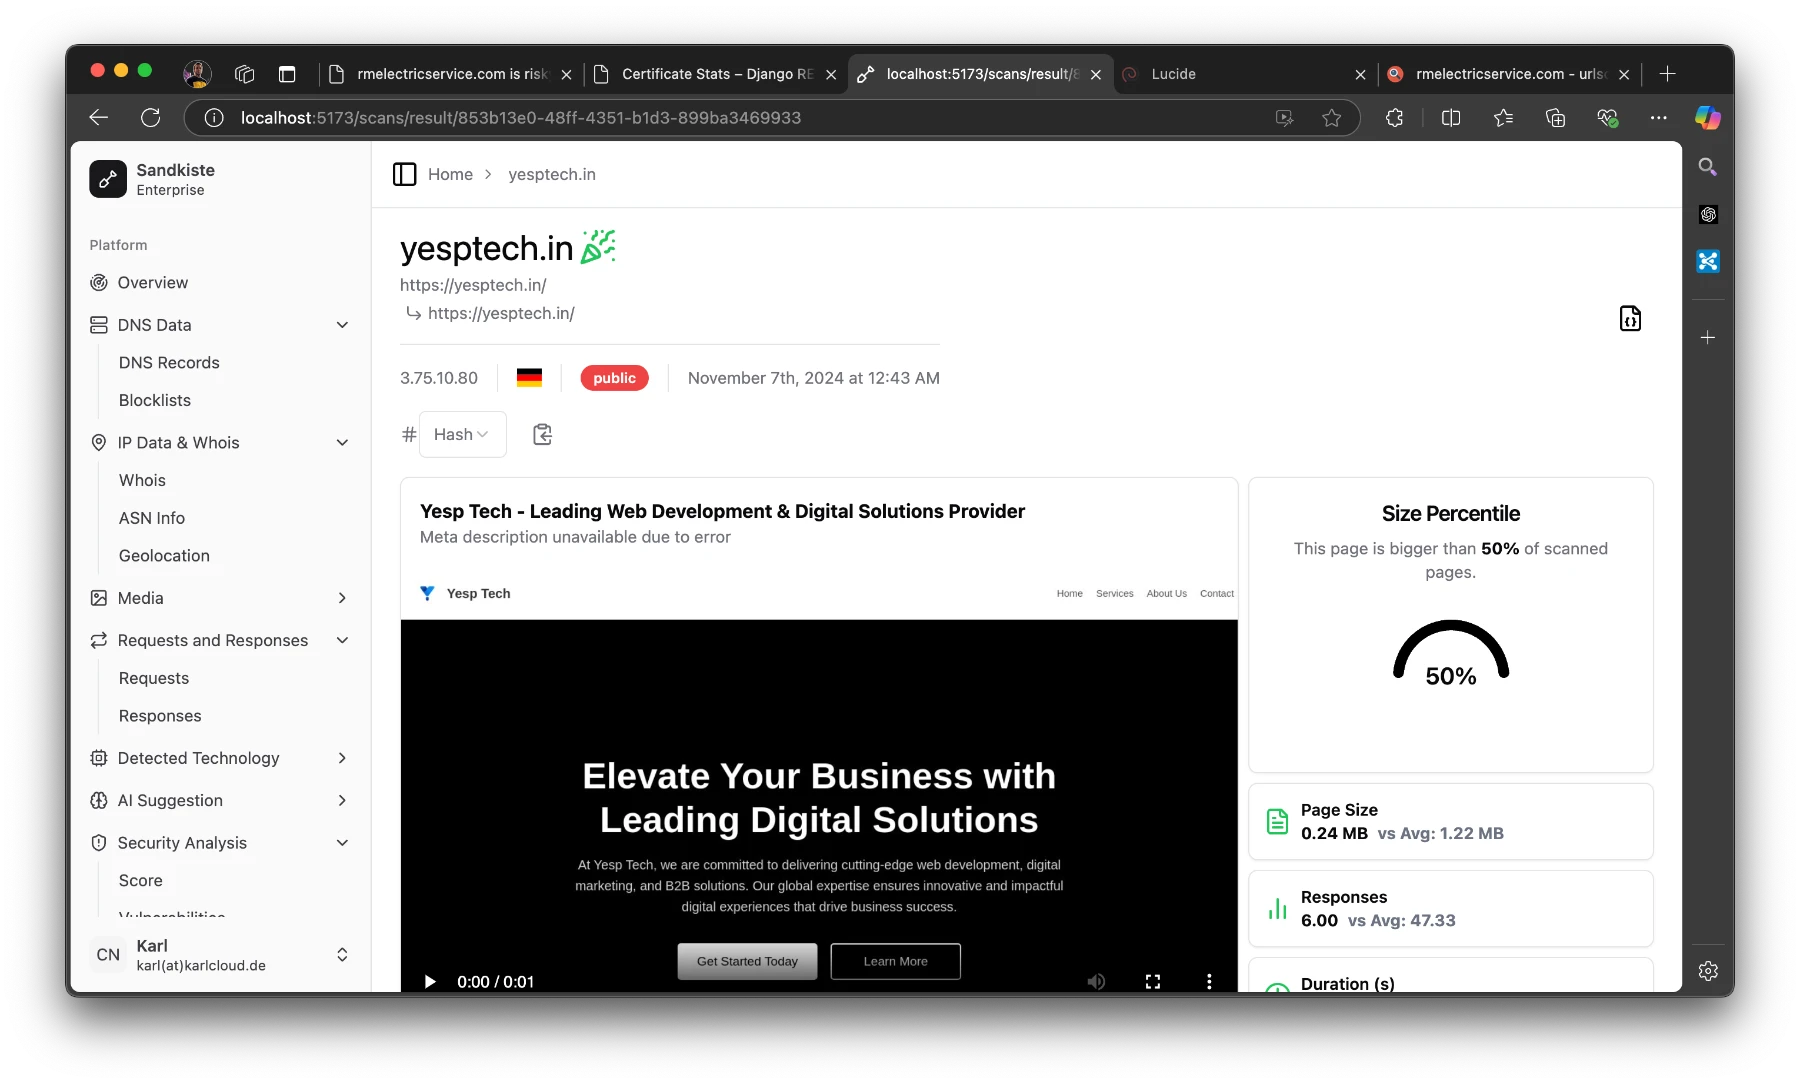
Statistics Panel
On the right side of the results page, there’s a statistics panel with several semi-technical but insightful metrics. Here’s what you can learn:
- Size Percentile:
- Indicates how the size of the page compares to other pages.
- Why it matters: Unusually large pages can be suspicious, as they might contain obfuscated code or hidden malware.
- Number of Responses:
- Shows how many requests and responses were exchanged with the server.
- Why it matters: A high number of responses could indicate excessive tracking, unnecessary redirects, or hidden third-party connections.
- Duration to “Network Idle”:
- Measures how long it took for the page to fully load and stop making network requests.
- Why it matters: Some pages continue running scripts in the background even after appearing fully loaded, which can signal malicious or resource-intensive behavior.
- Redirect Chain Analysis:
- A list of all redirects encountered during the session.
- Why it matters: A long chain of redirects is a common tactic in phishing, ad fraud, or malware distribution campaigns.
By combining these insights—visual evidence from the video, infrastructure details from detected technologies, and behavioral stats from the metrics—you get a comprehensive view of the website’s behavior. This layered approach helps security analysts identify potential threats with greater accuracy and confidence.

At the top of the page, you’ll see the starting URL and the final URL you were redirected to.
- “Public” means that others can view the scan.
- The German flag indicates that the page is hosted in Germany.
- The IP address shows the final server we landed on.
The party emoji signifies that the page is safe; if it weren’t, you’d see a red skull (spooky!). Earlier, I explained the criteria for flagging a page as good or bad.
On the “Responses” page I mentioned earlier, you can take a closer look at them. Here, you can see exactly where the redirects are coming from and going to. I’ve added a red shield icon to clearly indicate when HTTP is used instead of HTTPS.

As an analyst, it’s pretty common to review potentially malicious scripts. Clicking on one of the results will display the raw response safely. In the image below, I clicked on that long JavaScript URL (normally a risky move, but in Sandkiste, every link is completely safe!).


Conclusion
And that’s the story of Sandkiste.io, a project I built over the course of a month in my spare time. While the concept itself was exciting, the execution came with its own set of challenges. For me, the toughest part was achieving a real-time feel for the user experience while ensuring the asynchronous jobs running in the background were seamlessly synced back together. It required a deep dive into task coordination and real-time updates, but it taught me lessons that I now use with ease.
Currently, Sandkiste.io is still in beta and runs locally within our company’s network. It’s used internally by my team to streamline our work and enhance our incident response capabilities. Though it’s not yet available to the public, it has already proven its value in simplifying complex tasks and delivering insights that traditional tools couldn’t match.
Future Possibilities
While it’s an internal tool for now, I can’t help but imagine where this could go.
For now, Sandkiste.io remains a testament to what can be built with focus, creativity, and a drive to solve real-world problems. Whether it ever goes public or not, this project has been a milestone in my journey, and I’m proud of what it has already achieved. Who knows—maybe the best is yet to come!